SLOVENIA
INTRODUCTION
Background: The Slovene lands were part of the Austro-Hungarian Empire until the latter’s dissolution at the end of World War I. In 1918, the Slovenes joined the Serbs and Croats in forming a new multinational state, which was named Yugoslavia in 1929. After World War II, Slovenia was one of the republics in the restored Yugoslavia, which, though communist, soon distanced itself from the Soviet Union and spearheaded the Non-Aligned Movement. Dissatisfied with the exercise of power by the majority Serbs, the Slovenes succeeded in establishing their independence in 1991 after a short 10-day war. Historical ties to Western Europe, a growing economy, and a stable democracy have assisted in Slovenia’s postcommunist transition. Slovenia acceded to both NATO and the EU in the spring of 2004; it joined the euro zone and the Schengen Area in 2007.
GEOGRAPHY
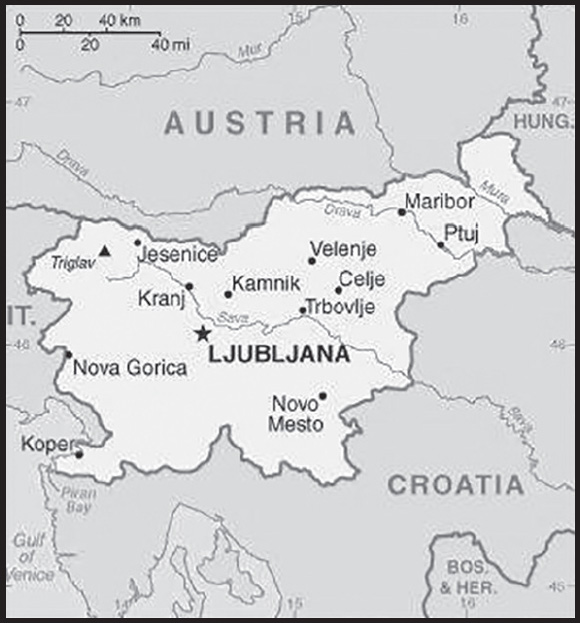
Location: south Central Europe, Julian Alps between Austria and Croatia
Geographic coordinates: 46 07 N, 14 49 E
Map references: Europe
Area: total: 20,273 sq km
land: 20,151 sq km
water: 122 sq km
comparison ranking: total 154
Area - comparative: slightly smaller than New Jersey
Land boundaries: total: 1,211 km
border countries (4): Austria 299 km; Croatia 600 km; Hungary 94 km; Italy 218 km
Coastline: 46.6 km
Maritime claims: territorial sea: 12 nm
Climate: Mediterranean climate on the coast, continental climate with mild to hot summers and cold winters in the plateaus and valleys to the east
Terrain: a short southwestern coastal strip of Karst topography on the Adriatic; an alpine mountain region lies adjacent to Italy and Austria in the north; mixed mountains and valleys with numerous rivers to the east
Elevation: highest point: Triglav 2,864 m
lowest point: Adriatic Sea 0 m
mean elevation: 492 m
Natural resources: lignite, lead, zinc, building stone, hydropower, forests
Land use: agricultural land: 22.8% (2018 est.)
arable land: 8.4% (2018 est.)
permanent crops: 1.3% (2018 est.)
permanent pasture: 13.1% (2018 est.)
forest: 62.3% (2018 est.)
other: 14.9% (2018 est.)
Irrigated land: 39 sq km (2020)
Major watersheds (area sq km): Atlantic Ocean drainage: (Black Sea) Danube (795,656 sq km)
Population distribution: a fairly even distribution throughout most of the country, with urban areas attracting larger and denser populations; pockets in the mountainous northwest exhibit less density than elsewhere
Natural hazards: flooding; earthquakes
Geography - note: despite its small size, this eastern Alpine country controls some of Europe’s major transit routes
PEOPLE AND SOCIETY
Population: 2,099,790 (2023 est.)
comparison ranking: 149
Nationality: noun: Slovene(s)
adjective: Slovenian
Ethnic groups: Slovene 83.1%, Serb 2%, Croat 1.8%, Bosniak 1.1%, other or unspecified 12% (2002 est.)
Languages: Slovene (official) 87.7%, Croatian 2.8%, Serbo-Croatian 1.8%, Bosnian 1.6%, Serbian 1.6%, Hungarian 0.4% (official, only in municipalities where Hungarian national communities reside), Italian 0.2% (official, only in municipalities where Italian national communities reside), other or unspecified 3.9% (2002 est.)
major-language sample(s):
Svetovni informativni zvezek - neobhoden vir osnovnih informacij. (Slovene)
Religions: Catholic 57.8%, Muslim 2.4%, Orthodox 2.3%, other Christian 1%, unaffiliated 3.5%, no response or unspecified 22.8%, none 10.1% (2002 est.)
Age structure: 0-14 years: 14.55% (male 156,499/female 148,987)
15-64 years: 62.73% (male 685,750/female 631,553)
65 years and over: 22.72% (2023 est.) (male 208,832/female 268,169)
Dependency ratios: total dependency ratio: 55.5
youth dependency ratio: 23.6
elderly dependency ratio: 31.9
potential support ratio: 3.1 (2021 est.)
Median age: total: 45.9 years (2023 est.)
male: 44.6 years
female: 47.5 years
comparison ranking: total 12
Population growth rate: -0.08% (2023 est.)
comparison ranking: 201
Birth rate: 8.1 births/1,000 population (2023 est.)
comparison ranking: 214
Death rate: 10.5 deaths/1,000 population (2023 est.)
comparison ranking: 29
Net migration rate: 1.5 migrant(s)/1,000 population (2023 est.)
comparison ranking: 62
Population distribution: a fairly even distribution throughout most of the country, with urban areas attracting larger and denser populations; pockets in the mountainous northwest exhibit less density than elsewhere
Urbanization: urban population: 56.1% of total population (2023)
rate of urbanization: 0.54% annual rate of change (2020-25 est.)
Major urban areas - population: 286,000 LJUBLJANA (capital) (2018)
Sex ratio: at birth: 1.04 male(s)/female
0-14 years: 1.05 male(s)/female
15-64 years: 1.09 male(s)/female
65 years and over: 0.78 male(s)/female
total population: 1 male(s)/female (2023 est.)
Mother’s mean age at first birth: 29 years (2020 est.)
Maternal mortality ratio: 5 deaths/100,000 live births (2020 est.)
comparison ranking: 172
Infant mortality rate: total: 1.5 deaths/1,000 live births (2023 est.)
male: 1.6 deaths/1,000 live births
female: 1.4 deaths/1,000 live births
comparison ranking: total 227
Life expectancy at birth: total population: 82 years (2023 est.)
male: 79.2 years
female: 85 years
comparison ranking: total population 34
Total fertility rate: 1.6 children born/woman (2023 est.)
comparison ranking: 184
Gross reproduction rate: 0.78 (2023 est.)
Drinking water source: improved:
total: 99.5% of population
unimproved: total: 0.5% of population (2020 est.)
Current health expenditure: 9.5% of GDP (2020)
Physicians density: 3.28 physicians/1,000 population (2019)
Hospital bed density: 4.4 beds/1,000 population (2018)
Sanitation facility access: improved:
total: 99% of population
unimproved: total: 1% of population (2020 est.)
Obesity - adult prevalence rate: 20.2% (2016)
comparison ranking: 104
Alcohol consumption per capita: total: 11.05 liters of pure alcohol (2019 est.)
beer: 4.54 liters of pure alcohol (2019 est.)
wine: 5.26 liters of pure alcohol (2019 est.)
spirits: 1.26 liters of pure alcohol (2019 est.)
other alcohols: 0 liters of pure alcohol (2019 est.)
comparison ranking: total 10
Tobacco use: total: 22% (2020 est.)
male: 24.4% (2020 est.)
female: 19.6% (2020 est.)
comparison ranking: total 73
Currently married women (ages 15-49): 46.4% (2023 est.)
Education expenditures: 5.8% of GDP (2020 est.)
comparison ranking: 49
Literacy: total population: 99.7%
male: 99.7%
female: 99.7% (2015)
School life expectancy (primary to tertiary education): total: 18 years
male: 17 years
female: 18 years (2020)
Youth unemployment rate (ages 15-24): total: 13.9% (2021 est.)
male: 12.7%
female: 15.5%
comparison ranking: total 125
ENVIRONMENT
Environment - current issues: air pollution from road traffic, domestic heating (wood buring), power generation, and industry; water pollution; biodiversity protection
Environment - international agreements: party to: Air Pollution, Air Pollution-Heavy Metals, Air Pollution-Multi-effect Protocol, Air Pollution-Nitrogen Oxides, Air Pollution-Persistent Organic Pollutants, Air Pollution-Sulphur 94, Antarctic Treaty, Biodiversity, Climate Change, Climate Change-Kyoto Protocol, Climate Change-Paris Agreement, Comprehensive Nuclear Test Ban, Desertification, Endangered Species, Environmental Modification, Hazardous Wastes, Law of the Sea, Marine Dumping-London Convention, Marine Dumping-London Protocol, Nuclear Test Ban, Ozone Layer Protection, Ship Pollution, Tropical Timber 2006, Wetlands, Whaling
signed, but not ratified: none of the selected agreements
Climate: Mediterranean climate on the coast, continental climate with mild to hot summers and cold winters in the plateaus and valleys to the east
Land use: agricultural land: 22.8% (2018 est.)
arable land: 8.4% (2018 est.)
permanent crops: 1.3% (2018 est.)
permanent pasture: 13.1% (2018 est.)
forest: 62.3% (2018 est.)
other: 14.9% (2018 est.)
Urbanization: urban population: 56.1% of total population (2023)
rate of urbanization: 0.54% annual rate of change (2020-25 est.)
Revenue from forest resources: 0.2% of GDP (2018 est.)
comparison ranking: 93
Revenue from coal: 0.03% of GDP (2018 est.)
comparison ranking: 41
Air pollutants: particulate matter emissions: 14.08 micrograms per cubic meter (2019 est.)
carbon dioxide emissions: 12.63 megatons (2016 est.)
methane emissions: 2.1 megatons (2020 est.)
Waste and recycling: municipal solid waste generated annually: 926,000 tons (2015 est.)
municipal solid waste recycled annually: 430,034 tons (2015 est.)
percent of municipal solid waste recycled: 46.4% (2015 est.)
Major watersheds (area sq km): Atlantic Ocean drainage: (Black Sea) Danube (795,656 sq km)
Total water withdrawal: municipal: 170 million cubic meters (2020 est.)
industrial: 830 million cubic meters (2020 est.)
agricultural: 3.9 million cubic meters (2017 est.)
Total renewable water resources: 31.87 billion cubic meters (2020 est.)
GOVERNMENT
Country name: conventional long form: Republic of Slovenia
conventional short form: Slovenia
local long form: Republika Slovenija
local short form: Slovenija
former: People’s Republic of Slovenia, Socialist Republic of Slovenia
etymology: the country’s name means “Land of the Slavs” in Slovene
Government type: parliamentary republic
Capital: name: Ljubljana
geographic coordinates: 46 03 N, 14 31 E
time difference: UTC+1 (6 hours ahead of Washington, DC, during Standard Time)
daylight saving time: +1hr, begins last Sunday in March; ends last Sunday in October
etymology: likely related to the Slavic root “ljub”, meaning “to like” or “to love”; by tradition, the name is related to the Slovene word “ljubljena” meaning “beloved”
Administrative divisions: 200 municipalities (obcine, singular - obcina) and 12 urban municipalities (mestne obcine, singular - mestna obcina)
municipalities: Ajdovscina, Ankaran, Apace, Beltinci, Benedikt, Bistrica ob Sotli, Bled, Bloke, Bohinj, Borovnica, Bovec, Braslovce, Brda, Brezice, Brezovica, Cankova, Cerklje na Gorenjskem, Cerknica, Cerkno, Cerkvenjak, Cirkulane, Crensovci, Crna na Koroskem, Crnomelj, Destrnik, Divaca, Dobje, Dobrepolje, Dobrna, Dobrova-Polhov Gradec, Dobrovnik/Dobronak, Dolenjske Toplice, Dol pri Ljubljani, Domzale, Dornava, Dravograd, Duplek, Gorenja Vas-Poljane, Gorisnica, Gorje, Gornja Radgona, Gornji Grad, Gornji Petrovci, Grad, Grosuplje, Hajdina, Hoce-Slivnica, Hodos, Horjul, Hrastnik, Hrpelje-Kozina, Idrija, Ig, Ilirska Bistrica, Ivancna Gorica, Izola/Isola, Jesenice, Jezersko, Jursinci, Kamnik, Kanal ob Soci, Kidricevo, Kobarid, Kobilje, Kocevje, Komen, Komenda, Kosanjevica na Krki, Kostel, Kozje, Kranjska Gora, Krizevci, Kungota, Kuzma, Lasko, Lenart, Lendava/Lendva, Litija, Ljubno, Ljutomer, Log-Dragomer, Logatec, Loska Dolina, Loski Potok, Lovrenc na Pohorju, Luce, Lukovica, Majsperk, Makole, Markovci, Medvode, Menges, Metlika, Mezica, Miklavz na Dravskem Polju, Miren-Kostanjevica, Mirna, Mirna Pec, Mislinja, Mokronog-Trebelno, Moravce, Moravske Toplice, Mozirje, Muta, Naklo, Nazarje, Odranci, Oplotnica, Ormoz, Osilnica, Pesnica, Piran/Pirano, Pivka, Podcetrtek, Podlehnik, Podvelka, Poljcane, Polzela, Postojna, Prebold, Preddvor, Prevalje, Puconci, Race-Fram, Radece, Radenci, Radlje ob Dravi, Radovljica, Ravne na Koroskem, Razkrizje, Recica ob Savinji, Rence-Vogrsko, Ribnica, Ribnica na Pohorju, Rogaska Slatina, Rogasovci, Rogatec, Ruse, Salovci, Selnica ob Dravi, Semic, Sempeter-Vrtojba, Sencur, Sentilj, Sentjernej, Sentjur, Sentrupert, Sevnica, Sezana, Skocjan, Skofja Loka, Skofljica, Slovenska Bistrica, Slovenske Konjice, Smarje pri Jelsah, Smarjeske Toplice, Smartno ob Paki, Smartno pri Litiji, Sodrazica, Solcava, Sostanj, Sredisce ob Dravi, Starse, Store, Straza, Sveta Ana, Sveta Trojica v Slovenskih Goricah, Sveti Andraz v Slovenskih Goricah, Sveti Jurij ob Scavnici, Sveti Jurij v Slovenskih Goricah, Sveti Tomaz, Tabor, Tisina, Tolmin, Trbovlje, Trebnje, Trnovska Vas, Trzic, Trzin, Turnisce, Velika Polana, Velike Lasce, Verzej, Videm, Vipava, Vitanje, Vodice, Vojnik, Vransko, Vrhnika, Vuzenica, Zagorje ob Savi, Zalec, Zavrc, Zelezniki, Zetale, Ziri, Zirovnica, Zrece, Zuzemberk
urban municipalities: Celje, Koper, Kranj, Krsko, Ljubljana, Maribor, Murska Sobota, Nova Gorica, Novo Mesto, Ptuj, Slovenj Gradec, Velenje
Independence: 25 June 1991 (from Yugoslavia)
National holiday: Independence Day/Statehood Day, 25 June (1991)
Constitution: history: previous 1974 (preindependence); latest passed by Parliament 23 December 1991
amendments: proposed by at least 20 National Assembly members, by the government, or by petition of at least 30,000 voters; passage requires at least two-thirds majority vote by the Assembly; referendum required if agreed upon by at least 30 Assembly members; passage in a referendum requires participation of a majority of eligible voters and a simple majority of votes cast; amended several times, last in 2016
Legal system: civil law system
International law organization participation: has not submitted an ICJ jurisdiction declaration; accepts ICCt jurisdiction
Citizenship: citizenship by birth: no
citizenship by descent only: at least one parent must be a citizen of Slovenia; both parents if the child is born outside of Slovenia
dual citizenship recognized: yes, for select cases
residency requirement for naturalization: 10 years, the last 5 of which have been continuous
Suffrage: 18 years of age; universal
Executive branch: chief of state: President Natasa PIRC MUSAR (since 23 December 2022); note - PIRC MUSAR is Slovenia’s first female president
head of government: Prime Minister Robert GOLOB (since 1 June 2022)
cabinet: Council of Ministers nominated by the prime minister, elected by the National Assembly
elections/appointments: president directly elected by absolute majority popular vote in 2 rounds if needed for a 5-year term (eligible for a second consecutive term); election last held on 23 October 2022 with a runoff on 13 November (next to be held in 2027); following National Assembly elections, the leader of the majority party or majority coalition usually nominated prime minister by the president and elected by the National Assembly
election results:
2022: Natasa PIRC MUSAR elected president in second round: percent of vote in first round - Anze LOGAR (SDS) 34%, Natasa PIRC MUSAR (independent) 26.9%, Milan BRGLEZ (SD) 15.5%, Vladimir PREBILIC (independent) 10.6%, Sabina SENCAR (Resni.ca) 5.9%, Janez CIGLER KRALJ (NSi) 4.4%, other 2.7%; percent of vote in second round - Natasa PIRC MUSAR 53.9%, Anze LOGAR 46.1%; Robert GOLOB (GS) elected prime minister on 25 May 2022, National Assembly vote - 54-30
2017: Borut PAHOR reelected president in second round; percent of vote in first round - Borut PAHOR (independent) 47.1%, Marjan SAREC (Marjan Sarec List) 25%, Romana TOMC (SDS) 13.7%, Ljudmila NOVAK (NSi) 7.2%, other 7%; percent of vote in second round - Borut PAHOR 52.9%, Marjan SAREC 47.1%
Legislative branch: description: bicameral Parliament consists of:
National Council (State Council)or Drzavni Svet (40 seats; members indirectly elected by an electoral college to serve 5-year terms); note - the Council is primarily an advisory body with limited legislative powers
National Assembly or Drzavni Zbor (90 seats; 88 members directly elected in single-seat constituencies by proportional representation vote and 2 directly elected in special constituencies for Italian and Hungarian minorities by simple majority vote; members serve 4-year terms)
elections:
National Council - last held on 24 November 2022 (next to be held in 2027)
National Assembly - last held on 24 April 2022 (next to be held in 2026)
election results:
National Council - percent of vote by party - NA; seats by party - NA; composition (as of January 2023) - men 33, women 7, percent of women 17.5%
National Assembly - percent of vote by party - GS 34.5%, SDS 23.5%, NSi 6.9%, SD 6.7%, Levica 4.4%, other 24%; seats by party - GS 41, SDS 27, NSi 8, SD 7, Levica 5; composition (as of January 2023) - men 56, women 34, percent of women 37.8%; note - total Parliament percent of women 31.5%
Judicial branch: highest court(s): Supreme Court (consists of the court president and 37 judges organized into civil, criminal, commercial, labor and social security, administrative, and registry departments); Constitutional Court (consists of the court president, vice president, and 7 judges)
judge selection and term of office: Supreme Court president and vice president appointed by the National Assembly upon the proposal of the Minister of Justice based on the opinions of the Judicial Council, an 11-member independent body elected by the National Assembly from proposals submitted by the president, attorneys, law universities, and sitting judges; other Supreme Court judges elected by the National Assembly from candidates proposed by the Judicial Council; Supreme Court judges serve for life; Constitutional Court judges appointed by the National Assembly from nominations by the president of the republic; Constitutional Court president selected from among its own membership for a 3-year term; other judges elected for single 9-year terms
subordinate courts: county, district, regional, and high courts; specialized labor-related and social courts; Court of Audit; Administrative Court
Political parties and leaders: Democratic Party of Pensioners of Slovenia or DeSUS [Ljubo JASNIC]
Freedom Movement or GS [Robert GOLOB] (formerly Greens Actions Party or Z.DEJ)
List of Marjan Sarec or LMS [Marjan SAREC]
New Slovenia - Christian Democrats or NSi [Matej TONIN]
Party of Alenka Bratusek or SAB [Alenka BRATUSEK] (formerly Alliance of Social Liberal Democrats or ZSD and before that Alliance of Alenka Bratusek or ZaAB)
Resni.ca [Zoran STEVANOVICH]
Slovenian Democratic Party or SDS [Janez JANSA] (formerly the Social Democratic Party of Slovenia or SDSS)
Slovenian National Party or SNS [Zmago JELINCIC Plemeniti]
Social Democrats or SD [Tanja FAJON]
The Left or Levica [Luka MESEC] (successor to United Left or ZL)
International organization participation: Australia Group, BIS, CD, CE, CEI, EAPC, EBRD, ECB, EIB, EMU, ESA (cooperating state), EU, FAO, IADB, IAEA, IBRD, ICAO, ICC (national committees), ICCt, ICRM, IDA, IFC, IFRCS, IHO, ILO, IMF, IMO, Interpol, IOC, IOM, IPU, ISO, ITU, MIGA, NATO, NEA, NSG, OAS (observer), OECD, OIF (observer), OPCW, OSCE, PCA, Schengen Convention, SELEC, UN, UNCTAD, UNESCO, UNHCR, UNIDO, UNIFIL, UNTSO, UNWTO, UPU, Wassenaar Arrangement, WCO, WHO, WIPO, WMO, WTO, ZC
Diplomatic representation in the US: chief of mission: Ambassador Iztok MIROŠIČ (since 15 September 2023)
chancery: 2410 California Street NW, Washington, DC 20008
telephone: [1] (202) 386-6611
FAX: [1] (202) 386-6633
email address and website:
http://www.washington.embassy.si/
consulate(s) general: Cleveland (OH)
Diplomatic representation from the US: chief of mission: Ambassador Jamie L. HARPOOTLIAN (since 17 February 2022)
embassy: Presernova 31, 1000 Ljubljana
mailing address: 7140 Ljubljana Place, Washington, DC 20521-7140
telephone: [386] (1) 200-5500
FAX: [386] (1) 200-5555
email address and website:
Flag description: three equal horizontal bands of white (top), blue, and red, derive from the medieval coat of arms of the Duchy of Carniola; the Slovenian seal (a shield with the image of Triglav, Slovenia’s highest peak, in white against a blue background at the center; beneath it are two wavy blue lines depicting seas and rivers, and above it are three six-pointed stars arranged in an inverted triangle, which are taken from the coat of arms of the Counts of Celje, the prominent Slovene dynastic house of the late 14th and early 15th centuries) appears in the upper hoist side of the flag centered on the white and blue bands
National symbol(s): Mount Triglav; national colors: white, blue, red
National anthem: name: “Zdravljica” (A Toast)
lyrics/music: France PRESEREN/Stanko PREMRL
note: adopted in 1989 while still part of Yugoslavia; originally written in 1848; the full poem, whose seventh verse is used as the anthem, speaks of pan-Slavic nationalism
National heritage: total World Heritage Sites: 5 (3 cultural, 2 natural)
selected World Heritage Site locales: Škocjan Caves (n); Ancient and Primeval Beech Forests of the Carpathians and Other Regions of Europe (n); Prehistoric Pile Dwellings around the Alps (c); Heritage of Mercury: Almadén and Idrija (c); The works of Jože Plečnik in Ljubljana (c)
ECONOMY
Economic overview: high-income, fast-growing EU-member economy; high human capital; key health infrastructure investments; high government spending; key Croatian investments; high-technology and manufacturing sectors; growing financial hub
Real GDP (purchasing power parity): $84.4 billion (2021 est.)
$77.996 billion (2020 est.)
$81.519 billion (2019 est.)
note: data are in 2017 dollars
comparison ranking: 97
Real GDP growth rate: 8.21% (2021 est.)
-4.32% (2020 est.)
3.45% (2019 est.)
comparison ranking: 38
Real GDP per capita: $40,000 (2021 est.)
$37,100 (2020 est.)
$39,000 (2019 est.)
note: data are in 2017 dollars
comparison ranking: 49
GDP (official exchange rate): $54.16 billion (2019 est.)
Inflation rate (consumer prices): 1.92% (2021 est.)
-0.05% (2020 est.)
1.63% (2019 est.)
comparison ranking: 159
Credit ratings: Fitch rating: A (2019)
Moody’s rating: A3 (2020)
Standard & Poors rating: AA- (2019)
note: The year refers to the year in which the current credit rating was first obtained.
GDP - composition, by sector of origin: agriculture: 1.8% (2017 est.)
industry: 32.2% (2017 est.)
services: 65.9% (2017 est.)
comparison rankings: services 91; industry 66; agriculture 179
GDP - composition, by end use: household consumption: 52.6% (2017 est.)
government consumption: 18.2% (2017 est.)
investment in fixed capital: 18.4% (2017 est.)
investment in inventories: 1.1% (2017 est.)
exports of goods and services: 82.3% (2017 est.)
imports of goods and services: -72.6% (2017 est.)
Agricultural products: milk, maize, wheat, grapes, barley, potatoes, poultry, apples, beef, pork
Industries: ferrous metallurgy and aluminum products, lead and zinc smelting; electronics (including military electronics), trucks, automobiles, electric power equipment, wood products, textiles, chemicals, machine tools
Industrial production growth rate: 9.43% (2021 est.)
comparison ranking: 33
Labor force: 1.036 million (2021 est.)
comparison ranking: 144
Labor force - by occupation: agriculture: 5.5%
industry: 31.2%
services: 63.3% (2017 est.)
Unemployment rate: 4.42% (2021 est.)
4.97% (2020 est.)
4.45% (2019 est.)
comparison ranking: 165
Youth unemployment rate (ages 15-24): total: 13.9% (2021 est.)
male: 12.7%
female: 15.5%
comparison ranking: total 125
Population below poverty line: 12% (2018 est.)
Gini Index coefficient - distribution of family income: 24.4 (2019 est.)
comparison ranking: 174
Average household expenditures: on food: 14.6% of household expenditures (2018 est.)
on alcohol and tobacco: 5.1% of household expenditures (2018 est.)
Household income or consumption by percentage share: lowest 10%: 3.8%
highest 10%: 20.1% (2016)
Budget: revenues: $23.735 billion (2019 est.)
expenditures: $23.456 billion (2019 est.)
Budget surplus (+) or deficit (-): 0% (of GDP) (2017 est.)
comparison ranking: 45
Public debt: 73.6% of GDP (2017 est.)
78.6% of GDP (2016 est.)
note: defined by the EU’s Maastricht Treaty as consolidated general government gross debt at nominal value, outstanding at the end of the year in the following categories of government liabilities: currency and deposits, securities other than shares excluding financial derivatives, and loans; general government sector comprises the central, state, local government, and social security funds
comparison ranking: 51
Taxes and other revenues: 16.92% (of GDP) (2020 est.)
comparison ranking: 121
Fiscal year: calendar year
Current account balance: $2.372 billion (2021 est.)
$4.058 billion (2020 est.)
$3.23 billion (2019 est.)
comparison ranking: 41
Exports: $51.634 billion (2021 est.) note: data are in current year dollars
$41.823 billion (2020 est.) note: data are in current year dollars
$45.516 billion (2019 est.) note: data are in current year dollars
comparison ranking: 60
Exports - partners: Germany 18%, Italy 11%, Croatia 8%, Austria 7%, France 5%, Switzerland 5% (2019)
Exports - commodities: packaged medicines, cars and vehicle parts, refined petroleum, electrical lighting/signaling equipment, electricity (2019)
Imports: $47.665 billion (2021 est.) note: data are in current year dollars
$36.804 billion (2020 est.) note: data are in current year dollars
$40.809 billion (2019 est.) note: data are in current year dollars
comparison ranking: 66
Imports - partners: Germany 14%, Italy 12%, Austria 8%, Switzerland 8%, China 7% (2019)
Imports - commodities: packaged medicines, cars and vehicle parts, refined petroleum, delivery trucks, electricity (2019)
Reserves of foreign exchange and gold: $2.267 billion (31 December 2021 est.)
$1.311 billion (31 December 2020 est.)
$1.015 billion (31 December 2019 est.)
comparison ranking: 129
Debt - external: $48.656 billion (2019 est.)
$50.004 billion (2018 est.)
comparison ranking: 69
Exchange rates: euros (EUR) per US dollar -
Exchange rates:
0.845 (2021 est.)
0.876 (2020 est.)
0.893 (2019 est.)
0.847 (2018 est.)
0.885 (2017 est.)
ENERGY
Electricity access: electrification - total population: 100% (2021)
Electricity: installed generating capacity: 4.062 million kW (2020 est.)
consumption: 13.447 billion kWh (2020 est.)
exports: 9.123 billion kWh (2020 est.)
imports: 7.12 billion kWh (2020 est.)
transmission/distribution losses: 848 million kWh (2020 est.)
comparison rankings: transmission/distribution losses 117; imports 33; exports 22; consumption 85; installed generating capacity 96
Electricity generation sources: fossil fuels: 27.2% of total installed capacity (2020 est.)
nuclear: 36.8% of total installed capacity (2020 est.)
solar: 2.2% of total installed capacity (2020 est.)
hydroelectricity: 32% of total installed capacity (2020 est.)
biomass and waste: 1.7% of total installed capacity (2020 est.)
Nuclear energy: Number of operational nuclear reactors: 1 (2023)
Number of nuclear reactors under construction: 0
Net capacity of operational nuclear reactors: 0.69GW (2023)
Percent of total electricity production: 36.9% (2021)
Percent of total energy produced: 40.6% (2021)
Number of nuclear reactors permanently shut down: 0
Coal: production: 3.175 million metric tons (2020 est.)
consumption: 3.502 million metric tons (2020 est.)
exports: 3,000 metric tons (2020 est.)
imports: 335,000 metric tons (2020 est.)
proven reserves: 371 million metric tons (2019 est.)
Petroleum: total petroleum production: 0 bbl/day (2021 est.)
refined petroleum consumption: 54,900 bbl/day (2019 est.)
Refined petroleum products - exports: 29,350 bbl/day (2017 est.)
comparison ranking: 63
Refined petroleum products - imports: 93,060 bbl/day (2017 est.)
comparison ranking: 56
Natural gas: production: 4.899 million cubic meters (2020 est.)
consumption: 904.439 million cubic meters (2020 est.)
exports: 0 cubic meters (2020 est.)
imports: 903.108 million cubic meters (2020 est.)
proven reserves: 0 cubic meters (2021 est.)
Carbon dioxide emissions: 13.553 million metric tonnes of CO2 (2019 est.)
from coal and metallurgical coke: 4.08 million metric tonnes of CO2 (2019 est.)
from petroleum and other liquids: 7.967 million metric tonnes of CO2 (2019 est.)
from consumed natural gas: 1.506 million metric tonnes of CO2 (2019 est.)
comparison ranking: total emissions 99
Energy consumption per capita: 134.836 million Btu/person (2019 est.)
comparison ranking: 39
COMMUNICATIONS
Telephones - fixed lines: total subscriptions: 695,444 (2021 est.)
subscriptions per 100 inhabitants: 33 (2021 est.)
comparison ranking: total subscriptions 82
Telephones - mobile cellular: total subscriptions: 2,607,268 (2021 est.)
subscriptions per 100 inhabitants: 123 (2021 est.)
comparison ranking: total subscriptions 146
Telecommunication systems: general assessment: Slovenia’s telecom sector is dominated by four operators; the mobile market has four MNOs and a small number of MVNOs, operating in a country with a potential market of just over two million people; the regulator in recent years has addressed the need for mobile operators to have more spectrum, so enabling them to improve the quality and range of services; a multi-spectrum auction was concluded in mid-2021, aimed at supporting 5G services; the broadband market continues to be dominated by a small number of players; DSL lost its dominance some years ago, being taken over by fiber as subscribers are migrated to new fiber-based networks; fiber accounted for almost half of all fixed broadband connections by March 2022 (2022)
domestic: fixed-line is 33 per 100 and mobile-cellular is 123 per 100 teledensity (2021)
international: country code - 386 (2016)
Broadcast media: public TV broadcaster, Radiotelevizija Slovenija (RTV), operates a system of national and regional TV stations; 35 domestic commercial TV stations operating nationally, regionally, and locally; about 60% of households are connected to multi-channel cable TV; public radio broadcaster operates 3 national and 4 regional stations; more than 75 regional and local commercial and non-commercial radio stations
Internet country code: .si
Internet users: total: 1.869 million (2021 est.)
percent of population: 89% (2021 est.)
comparison ranking: total 136
Broadband - fixed subscriptions: total: 651,604 (2020 est.)
subscriptions per 100 inhabitants: 31 (2020 est.)
comparison ranking: total 84
TRANSPORTATION
National air transport system: number of registered air carriers: 2 (2020)
inventory of registered aircraft operated by air carriers: 21
annual passenger traffic on registered air carriers: 1,094,762 (2018)
annual freight traffic on registered air carriers: 540,000 (2018) mt-km
Civil aircraft registration country code prefix: S5
Airports: 16 (2021)
comparison ranking: total 144
Airports - with paved runways: 9
civil airports: 3
military airports: 0
joint use (civil-military) airports: 1
other airports: 5
note: paved runways have a concrete or asphalt surface but not all have facilities for refueling, maintenance, or air traffic control; the length of a runway required for aircraft to safely operate depends on a number of factors including the type of aircraft, the takeoff weight (including passengers, cargo, and fuel), engine types, flap settings, landing speed, elevation of the airport, and average maximum daily air temperature; paved runways can reach a length of 5,000 m (16,000 ft.), but the “typical” length of a commercial airline runway is between 2,500-4,000 m (8,000-13,000 ft.)
Airports - with unpaved runways: 7
note: unpaved runways have a surface composition such as grass or packed earth and are most suited to the operation of light aircraft; unpaved runways are usually short, often less than 1,000 m (3,280 ft.) in length; airports with unpaved runways often lack facilities for refueling, maintenance, or air traffic control
Pipelines: 1,155 km gas, 5 km oil (2018)
Railways: total: 1,207 km (2020) 609 km electrified
comparison ranking: total 86
Roadways: total: 38,985 km (2012)
paved: 38,985 km (2012) (includes 769 km of expressways)
comparison ranking: total 90
Waterways: 710 km (2022) (some transport on the Drava River)
comparison ranking: 81
Merchant marine: total: 9 (2022)
by type: general cargo 1, other 8
comparison ranking: total 161
Ports and terminals: major seaport(s): Koper
MILITARY AND SECURITY
Military and security forces: Slovenian Armed Forces (Slovenska Vojska, SV): structured as a combined force with air, land, maritime, special operations, combat support, and combat service support elements
Ministry of Interior: National Police (2023)
Military expenditures: 1.4% of GDP (2023 est.)
1.3% of GDP (2022 est.)
1.2% of GDP (2021)
1% of GDP (2020)
1.1% of GDP (2019)
comparison ranking: 98
Military and security service personnel strengths: approximately 6,000 active-duty troops (2023)
Military equipment inventories and acquisitions: the military’s inventory is a mix of Soviet-era and smaller quantities of more modern, mostly Western equipment; in recent years, it has imported limited amounts of equipment from a few European countries and the US (2023)
Military service age and obligation: 18-30 years of age for voluntary military service for men and women; must be a citizen of the Republic of Slovenia; recruits sign up for 3-, 5-, or 10-year service contracts; conscription abolished in 2003 (2023)
note: as of 2023, women comprised about 16% of the military’s full-time personnel
Military deployments: 200 Kosovo (NATO); 100 Slovakia (NATO) (2023)
note: in response to Russia’s 2022 invasion of Ukraine, some NATO countries, including Slovenia, have sent additional troops and equipment to the battlegroups deployed in NATO territory in eastern Europe
Military - note: the Slovenian Armed Forces (Slovenska Vojska or SV) are a small and professional military responsible for the defense of the country’s sovereignty and territory, deterring external threats, and contributing to European security and other international peacekeeping missions; the SV is also active in civil-military cooperation, such as the maintenance of local infrastructure; Slovenia has been a member of the EU and NATO since 2004, and one of the SV’s key missions is fulfilling the country’s commitments to NATO, including equipment modernization, participating in training exercises, and contributing to NATO missions; the SV provides troops to NATO’s efforts to enhance its presence in the Baltics (Latvia) and Eastern Europe (Slovakia); it has also participated in other international security missions with small numbers of personnel in such places as Africa, southern Europe, the Mediterranean Sea, and the Middle East
the SV was formally established in 1993 as a reorganization of the Slovenia Defense Force; the Defense Force, along with the Slovenian police, comprised the majority of the forces that engaged with the Yugoslav People’s Army during the Ten-Day War after Slovenia declared its independence in 1991; the modern SV is configured as a joint force with land, naval, air, and special forces components; the SV is led by a General Staff with a joint-service Forces Command controlling the operational elements; the principal land combat units are two infantry brigades, but they may be organized as battlegroups or other response forces based on their mission; the naval component has two patrol boats; the SV air component has no fighter aircraft, and NATO allies Hungary and Italy provide air policing for Slovenia (2023)
TRANSNATIONAL ISSUES
Disputes - international: Slovenia-Austria: none identified
Slovenia-Croatia: since the breakup of Yugoslavia in the early 1990s, Croatia and Slovenia have each claimed sovereignty over Piran Bay and four villages, and Slovenia has objected to Croatia’s claim of an exclusive economic zone in the Adriatic Sea; in 2009, however Croatia and Slovenia signed a binding international arbitration agreement to define their disputed land and maritime borders, which led Slovenia to lift its objections to Croatia joining the EU; in June 2017, the Permanent Court of Arbitration issued a ruling on the border, but Croatia had withdrawn from the proceedings in 2015 and refused to implement it; as a member state that forms part of the EU’s external border, Slovenia has implemented the strict Schengen border rules to curb illegal migration and commerce through southeastern Europe while encouraging close cross-border ties with Croatia
Slovenia-Hungary: none identified
Slovenia-Italy: none identified
Refugees and internally displaced persons: refugees (country of origin): 10,435 (Ukraine) (as of 13 November 2023)
stateless persons: 10 (2020)
note: 6174,747 estimated refugee and migrant arrivals (January 2015-October 2023)
Illicit drugs: minor transit point for cocaine and Southwest Asian heroin bound for Western Europe, and for precursor chemicals
SOLOMON ISLANDS
INTRODUCTION
Background: Settlers from Papua arrived on Solomon Islands around 30,000 years ago. About 6,000 years ago, Austronesian settlers came to Solomon Islands and the two groups mixed extensively. Despite significant inter-island trade, no attempts were made to unite the islands into a single political entity. In 1568, Spanish explorer Alvaro de MENDANA became the first European to spot the islands. After a failed Spanish attempt at creating a permanent European settlement on the islands in the late 1500s, Solomon Islands remained free of European contact until 1767 when British explorer Philip CARTERET sailed by the islands. The islands were regularly visited by European explorers and American and British whaling ships into the 1800s, followed by missionaries in the 1850s.
Germany declared a protectorate over the northern Solomon Islands in 1885, and the UK established a protectorate over the southern islands in 1893. In 1899, Germany transferred its Solomon Islands to the UK in exchange for the UK relinquishing all claims in Samoa. The UK tried to encourage plantation farming, but few Europeans were willing to go to Solomon Islands and the UK left most services - such as education and medical services - to missionaries. In 1942, Japan invaded Solomon Islands and significant battles against Allied forces during the Guadalcanal Campaign proved a turning point in the Pacific war. World War II destroyed large parts of Solomon Islands and a nationalism movement emerged near the end of the war. By 1960, the British relented to allow for some local autonomy. The islands were granted self-government in 1976 and independence two years later under Prime Minister Sir Peter KENILOREA.
In 1999, longstanding ethnic tensions between ethnic Guale in Honiara and ethnic Malaitans in Honiara’s suburbs erupted in civil war, leading thousands of Malaitans to take refuge in Honiara and Guale to flee the city. In 2000, newly-elected Prime Minister Manasseh SOGAVARE focused on peace agreements and distributing resources equally among groups, but his actions bankrupted the government in 2001 and led to SOGAVARE’s ouster. In 2003, Solomon Islands requested international assistance to reestablish law and order. The Australian-led Regional Assistance Mission to the Solomon Islands, which ended in 2017, was generally effective in improving the security situation. In 2006, riots broke out in Honiara and the city’s Chinatown burned over allegations that the prime minister took money from China. SOGAVARE was reelected prime minister for a fourth time following elections in 2019 and that same year announced Solomon Islands would switch diplomatic recognition from Taiwan to China. In late November 2021, protestors, mostly from the island of Malaita, calling for SOGAVARE’s removal and more development in Malaita, sparked rioting in Honiara.
GEOGRAPHY
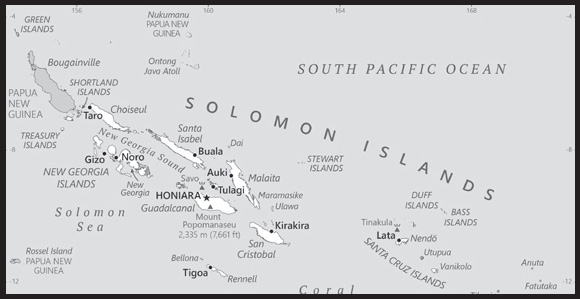
Location: Oceania, group of islands in the South Pacific Ocean, east of Papua New Guinea
Geographic coordinates: 8 00 S, 159 00 E
Map references: Oceania
Area: total: 28,896 sq km
land: 27,986 sq km
water: 910 sq km
comparison ranking: total 143
Area - comparative: slightly smaller than Maryland
Land boundaries: total: 0 km
Coastline: 5,313 km
Maritime claims: territorial sea: 12 nm
exclusive economic zone: 200 nm
continental shelf: 200 nm
measured from claimed archipelagic baselines
Climate: tropical monsoon; few temperature and weather extremes
Terrain: mostly rugged mountains with some low coral atolls
Elevation: highest point: Mount Popomanaseu 2,335 m
lowest point: Pacific Ocean 0 m
Natural resources: fish, forests, gold, bauxite, phosphates, lead, zinc, nickel
Land use: agricultural land: 3.9% (2018 est.)
arable land: 0.7% (2018 est.)
permanent crops: 2.9% (2018 est.)
permanent pasture: 0.3% (2018 est.)
forest: 78.9% (2018 est.)
other: 17.2% (2018 est.)
Irrigated land: 0 sq km (2022)
Population distribution: most of the population lives along the coastal regions; about one in five live in urban areas, and of these some two-thirds reside in Honiara, the largest town and chief port
Natural hazards: tropical cyclones, but rarely destructive; geologically active region with frequent earthquakes, tremors, and volcanic activity; tsunamis
volcanism: Tinakula (851 m) has frequent eruption activity, while an eruption of Savo (485 m) could affect the capital Honiara on nearby Guadalcanal
Geography - note: strategic location on sea routes between the South Pacific Ocean, the Solomon Sea, and the Coral Sea; Rennell Island, the southernmost in the Solomon Islands chain, is one of the world’s largest raised coral atolls; the island’s Lake Tegano, formerly a lagoon on the atoll, is the largest lake in the insular Pacific (15,500 hectares)
PEOPLE AND SOCIETY
Population: 714,766 (2023 est.)
comparison ranking: 167
Nationality: noun: Solomon Islander(s)
adjective: Solomon Islander
Ethnic groups: Melanesian 95.3%, Polynesian 3.1%, Micronesian 1.2%, other 0.3% (2009 est.)
Languages: Melanesian pidgin (in much of the country is lingua franca), English (official but spoken by only 1%-2% of the population), 120 indigenous languages
Religions: Protestant 73.4% (Church of Melanesia 31.9%, South Sea Evangelical 17.1%, Seventh Day Adventist 11.7%, United Church 10.1%, Christian Fellowship Church 2.5%), Roman Catholic 19.6%, other Christian 2.9%, other 4%, unspecified 0.1% (2009 est.)
Age structure: 0-14 years: 31.06% (male 114,104/female 107,900)
15-64 years: 63.82% (male 233,501/female 222,640)
65 years and over: 5.12% (2023 est.) (male 17,238/female 19,383)
Dependency ratios: total dependency ratio: 74.8
youth dependency ratio: 68.8
elderly dependency ratio: 6
potential support ratio: 16.5 (2021 est.)
Median age: total: 24.8 years (2023 est.)
male: 24.6 years
female: 25 years
comparison ranking: total 169
Population growth rate: 1.69% (2023 est.)
comparison ranking: 55
Birth rate: 22.3 births/1,000 population (2023 est.)
comparison ranking: 53
Death rate: 4 deaths/1,000 population (2023 est.)
comparison ranking: 215
Net migration rate: -1.5 migrant(s)/1,000 population (2023 est.)
comparison ranking: 159
Population distribution: most of the population lives along the coastal regions; about one in five live in urban areas, and of these some two-thirds reside in Honiara, the largest town and chief port
Urbanization: urban population: 26% of total population (2023)
rate of urbanization: 3.57% annual rate of change (2020-25 est.)
Major urban areas - population: 82,000 HONIARA (capital) (2018)
Sex ratio: at birth: 1.05 male(s)/female
0-14 years: 1.06 male(s)/female
15-64 years: 1.05 male(s)/female
65 years and over: 0.89 male(s)/female
total population: 1.04 male(s)/female (2023 est.)
Mother’s mean age at first birth: 22.6 years (2015 est.)
note: data represents median age at first birth among women 25-29
Maternal mortality ratio: 122 deaths/100,000 live births (2020 est.)
comparison ranking: 64
Infant mortality rate: total: 19.5 deaths/1,000 live births (2023 est.)
male: 23.3 deaths/1,000 live births
female: 15.6 deaths/1,000 live births
comparison ranking: total 79
Life expectancy at birth: total population: 77 years (2023 est.)
male: 74.3 years
female: 79.7 years
comparison ranking: total population 94
Total fertility rate: 2.82 children born/woman (2023 est.)
comparison ranking: 56
Gross reproduction rate: 1.38 (2023 est.)
Contraceptive prevalence rate: 29.3% (2015)
Drinking water source: improved: urban: 95% of population
rural: 65.9% of population
total: 73.1% of population
unimproved: urban: 5% of population
rural: 34.1% of population
total: 26.9% of population (2020 est.)
Current health expenditure: 4.4% of GDP (2020)
Physicians density: 0.19 physicians/1,000 population (2016)
Hospital bed density: 1.4 beds/1,000 population (2012)
Sanitation facility access: improved: urban: 95.6% of population
rural: 22.6% of population
total: 40.6% of population
unimproved: urban: 4.4% of population
rural: 77.4% of population
total: 59.4% of population (2020 est.)
Obesity - adult prevalence rate: 22.5% (2016)
comparison ranking: 75
Alcohol consumption per capita: total: 1.19 liters of pure alcohol (2019 est.)
beer: 1.1 liters of pure alcohol (2019 est.)
wine: 0.06 liters of pure alcohol (2019 est.)
spirits: 0.02 liters of pure alcohol (2019 est.)
other alcohols: 0 liters of pure alcohol (2019 est.)
comparison ranking: total 146
Tobacco use: total: 36.5% (2020 est.)
male: 53.8% (2020 est.)
female: 19.2% (2020 est.)
comparison ranking: total 12
Children under the age of 5 years underweight: 16.2% (2015)
comparison ranking: 32
Currently married women (ages 15-49): 64.1% (2023 est.)
Education expenditures: 12.8% of GDP (2020 est.)
comparison ranking: 2
Youth unemployment rate (ages 15-24): total: 1.9% (2021 est.)
male: 1.6%
female: 2.3%
comparison ranking: total 200
ENVIRONMENT
Environment - current issues: deforestation; soil erosion; many of the surrounding coral reefs are dead or dying, exhibiting the effects of climate change and rising sea levels
Environment - international agreements: party to: Biodiversity, Climate Change, Climate Change-Kyoto Protocol, Climate Change-Paris Agreement, Desertification, Endangered Species, Environmental Modification, Law of the Sea, Marine Dumping-London Convention, Marine Life Conservation, Ozone Layer Protection, Ship Pollution, Whaling
signed, but not ratified: Comprehensive Nuclear Test Ban
Climate: tropical monsoon; few temperature and weather extremes
Land use: agricultural land: 3.9% (2018 est.)
arable land: 0.7% (2018 est.)
permanent crops: 2.9% (2018 est.)
permanent pasture: 0.3% (2018 est.)
forest: 78.9% (2018 est.)
other: 17.2% (2018 est.)
Urbanization: urban population: 26% of total population (2023)
rate of urbanization: 3.57% annual rate of change (2020-25 est.)
Revenue from forest resources: 20.27% of GDP (2018 est.)
comparison ranking: 1
Revenue from coal: 0% of GDP (2018 est.)
comparison ranking: 150
Air pollutants: particulate matter emissions: 7.83 micrograms per cubic meter (2019 est.)
carbon dioxide emissions: 0.17 megatons (2016 est.)
methane emissions: 0.43 megatons (2020 est.)
Waste and recycling: municipal solid waste generated annually: 179,972 tons (2013 est.)
Total renewable water resources: 44.7 billion cubic meters (2020 est.)
GOVERNMENT
Country name: conventional long form: none
conventional short form: Solomon Islands
local long form: none
local short form: Solomon Islands
former: British Solomon Islands
etymology: Spanish explorer Alvaro de MENDANA named the isles in 1568 after the wealthy biblical King SOLOMON in the mistaken belief that the islands contained great riches
Government type: parliamentary democracy under a constitutional monarchy; a Commonwealth realm
Capital: name: Honiara
geographic coordinates: 9 26 S, 159 57 E
time difference: UTC+11 (16 hours ahead of Washington, DC, during Standard Time)
etymology: the name derives from “nagho ni ara,” which in one of the Guadalcanal languages roughly translates as “facing the eastern wind”
Administrative divisions: 9 provinces and 1 city*; Central, Choiseul, Guadalcanal, Honiara*, Isabel, Makira and Ulawa, Malaita, Rennell and Bellona, Temotu, Western
Independence: 7 July 1978 (from the UK)
National holiday: Independence Day, 7 July (1978)
Constitution: history: adopted 31 May 1978, effective 7 July 1978; note - in late 2017, provincial leaders agreed to adopt a new federal constitution; progress has been stalled, but as of February 2023, the draft constitution was with the Constitutional Review Unit in the prime minister’s office
amendments: proposed by the National Parliament; passage of constitutional sections, including those on fundamental rights and freedoms, the legal system, Parliament, alteration of the constitution and the ombudsman, requires three-fourths majority vote by Parliament and assent of the governor general; passage of other amendments requires two-thirds majority vote and assent of the governor general; amended several times, last in 2018
Legal system: mixed legal system of English common law and customary law
International law organization participation: has not submitted an ICJ jurisdiction declaration; non-party state to the ICCt
Citizenship: citizenship by birth: no
citizenship by descent only: at least one parent must be a citizen of the Solomon Islands
dual citizenship recognized: no
residency requirement for naturalization: 7 years
Suffrage: 21 years of age; universal
Executive branch: chief of state: King CHARLES III (since 8 September 2022); represented by Governor General David VUNAGI (since 8 July 2019)
head of government: Prime Minister Manasseh SOGAVARE (since 24 April 2019)
cabinet: Cabinet appointed by the governor general on the advice of the prime minister
elections/appointments: the monarchy is hereditary; governor general appointed by the monarch on the advice of the National Parliament for up to 5 years (eligible for a second term); following legislative elections, the leader of the majority party or majority coalition usually elected prime minister by the National Parliament; deputy prime minister appointed by the governor general on the advice of the prime minister from among members of the National Parliament
election results: Manasseh SOGAVARE elected prime minister on 24 April 2019
Legislative branch: description: unicameral National Parliament (50 seats; members directly elected in single-seat constituencies by simple majority vote to serve 4-year terms)
elections: last held on 3 April 2019 (next originally scheduled for April 2023, but delayed until 2024)
election results: percent of vote by party - UDP 10.7%, DAP 7.8%, PAP 4.4%, independent 56.3%, other 20.8%; seats by party - DAP 7, UDP 5, PAP 3, KPSI 1, SIPFP 1, SIPRA 1, independent 32; composition - men 46, women 4, percent of women 8%
Judicial branch: highest court(s): Court of Appeal (consists of the court president and ex officio members including the High Court chief justice and its puisne judges); High Court (consists of the chief justice and puisne judges, as prescribed by the National Parliament)
judge selection and term of office: Court of Appeal and High Court president, chief justices, and puisne judges appointed by the governor general upon recommendation of the Judicial and Legal Service Commission, chaired by the chief justice and includes 5 members, mostly judicial officials and legal professionals; all judges serve until retirement at age 60
subordinate courts: Magistrates’ Courts; Customary Land Appeal Court; local courts
Political parties and leaders: Democratic Alliance Party or DAP [Steve ABANA]
Kadere Party of Solomon Islands or KPSI [Peter BOYERS]
People’s Alliance Party or PAP [Sir Nathaniel WAENA]
Solomon Islands Party for Rural Advancement or SIPRA [Manasseh MAELANGA]
Solomon Islands People First Party or SIPFP [Dr. Jimmie RODGERS]
United Democratic Party or UDP [Sir Thomas Ko CHAN]
note: in general, Solomon Islands politics is characterized by fluid coalitions
International organization participation: ACP, ADB, AOSIS, C, EITI (candidate country), ESCAP, FAO, G-77, IBRD, ICAO, ICRM, IDA, IFAD, IFC, IFRCS, ILO, IMF, IMO, IOC, ITU, MIGA, OPCW, PIF, Sparteca, SPC, UN, UNCTAD, UNESCO, UPU, WFTU, WHO, WMO, WTO
Diplomatic representation in the US: chief of mission: Ambassador Jane Mugafalu Kabui WAETARA (since 16 September 2022)
chancery: 685 Third Avenue, 11th Floor, Suite 1102, New York, NY 10017
telephone: [1] (212) 599-6192
FAX: [1] (212) 661-8925
email address and website:
Diplomatic representation from the US: embassy: the US does not have an embassy in the Solomon Islands; the US Ambassador to Papua New Guinea is accredited to the Solomon Islands
Flag description: divided diagonally by a thin yellow stripe from the lower hoist-side corner; the upper triangle (hoist side) is blue with five white five-pointed stars arranged in an X pattern; the lower triangle is green; blue represents the ocean, green the land, and yellow sunshine; the five stars stand for the five main island groups of the Solomon Islands
National symbol(s): national colors: blue, yellow, green, white
National anthem: name: “God Save Our Solomon Islands”
lyrics/music: Panapasa BALEKANA and Matila BALEKANA/Panapasa BALEKANA
note: adopted 1978
National heritage: total World Heritage Sites: 1 (natural)
selected World Heritage Site locales: East Rennell
ECONOMY
Economic overview: lower middle-income Pacific island economy; natural resource rich but environmentally fragile; key agrarian sector; growing Chinese economic relationship; infrastructure damage due to social unrest; metal mining operations
Real GDP (purchasing power parity): $1.703 billion (2021 est.)
$1.707 billion (2020 est.)
$1.766 billion (2019 est.)
note: data are in 2017 dollars
comparison ranking: 201
Real GDP growth rate: -0.2% (2021 est.)
-3.38% (2020 est.)
1.75% (2019 est.)
comparison ranking: 195
Real GDP per capita: $2,400 (2021 est.)
$2,500 (2020 est.)
$2,600 (2019 est.)
note: data are in 2017 dollars
comparison ranking: 203
GDP (official exchange rate): $1.298 billion (2017 est.)
Inflation rate (consumer prices): -0.12% (2021 est.)
2.96% (2020 est.)
1.63% (2019 est.)
comparison ranking: 216
Credit ratings: Moody’s rating: B3 (2015)
note: The year refers to the year in which the current credit rating was first obtained.
GDP - composition, by sector of origin: agriculture: 34.3% (2017 est.)
industry: 7.6% (2017 est.)
services: 58.1% (2017 est.)
comparison rankings: services 136; industry 212; agriculture 14
GDP - composition, by end use: exports of goods and services: 25.8% (2011 est.)
imports of goods and services: -49.6% (2011 est.)
Agricultural products: oil palm fruit, sweet potatoes, coconuts, taro, yams, fruit, pulses, vegetables, cocoa, cassava
Industries: fish (tuna), mining, timber
Industrial production growth rate: -3.84% (2020 est.)
comparison ranking: 183
Labor force: 366,000 (2021 est.)
comparison ranking: 164
Labor force - by occupation: agriculture: 75%
industry: 5%
services: 20% (2000 est.)
Unemployment rate: 1.03% (2021 est.)
0.92% (2020 est.)
0.75% (2019 est.)
comparison ranking: 222
Youth unemployment rate (ages 15-24): total: 1.9% (2021 est.)
male: 1.6%
female: 2.3%
comparison ranking: total 200
Population below poverty line: 12.7% (2012 est.)
Gini Index coefficient - distribution of family income: 37.1 (2013 est.)
comparison ranking: 80
Budget: revenues: $514 million (2019 est.)
expenditures: $537 million (2019 est.)
Budget surplus (+) or deficit (-): -2.9% (of GDP) (2017 est.)
comparison ranking: 127
Public debt: 11.46% of GDP (2020 est.)
7.74% of GDP (2019 est.)
7.69% of GDP (2018 est.)
comparison ranking: 198
Taxes and other revenues: 21.05% (of GDP) (2020 est.)
comparison ranking: 82
Fiscal year: calendar year
Current account balance: -$78.192 million (2021 est.)
-$25.06 million (2020 est.)
-$153.998 million (2019 est.)
comparison ranking: 89
Exports: $413.657 million (2021 est.) note: data are in current year dollars
$428.834 million (2020 est.) note: data are in current year dollars
$591.293 million (2019 est.) note: data are in current year dollars
comparison ranking: 191
Exports - partners: China 59%, Italy 9%, India 6%, Netherlands 4%, Australia 3% (2021)
Exports - commodities: lumber, tuna, palm oil, coconut oil, gold (2021)
Imports: $619.46 million (2021 est.) note: data are in current year dollars
$556.26 million (2020 est.) note: data are in current year dollars
$752.909 million (2019 est.) note: data are in current year dollars
comparison ranking: 197
Imports - partners: China 36%, Singapore 13%, Australia 12%, Malaysia 10%, New Zealand 6% (2021)
Imports - commodities: refined petroleum, scrap iron, fish, iron structures, poultry meats, rice (2021)
Reserves of foreign exchange and gold: $694.515 million (31 December 2021 est.)
$660.996 million (31 December 2020 est.)
$571.632 million (31 December 2019 est.)
comparison ranking: 160
Debt - external: $757 million (31 December 2017 est.)
$643 million (31 December 2016 est.)
comparison ranking: 172
Exchange rates: Solomon Islands dollars (SBD) per US dollar -
Exchange rates:
8.03 (2021 est.)
8.213 (2020 est.)
8.173 (2019 est.)
7.953 (2018 est.)
7.887 (2017 est.)
ENERGY
Electricity access: electrification - total population: 76.3% (2021)
electrification - urban areas: 79.2% (2021)
electrification - rural areas: 75.3% (2021)
Electricity: installed generating capacity: 40,000 kW (2020 est.)
consumption: 93.527 million kWh (2019 est.)
exports: 0 kWh (2020 est.)
imports: 0 kWh (2020 est.)
transmission/distribution losses: 14 million kWh (2019 est.)
comparison rankings: imports 146; exports 133; installed generating capacity 196; transmission/distribution losses 190; consumption 196
Electricity generation sources: fossil fuels: 94.8% of total installed capacity (2020 est.)
solar: 2.7% of total installed capacity (2020 est.)
biomass and waste: 2.6% of total installed capacity (2020 est.)
Petroleum: total petroleum production: 0 bbl/day (2021 est.)
refined petroleum consumption: 2,200 bbl/day (2019 est.)
Refined petroleum products - imports: 1,577 bbl/day (2015 est.)
comparison ranking: 194
Carbon dioxide emissions: 333,000 metric tonnes of CO2 (2019 est.)
from petroleum and other liquids: 333,000 metric tonnes of CO2 (2019 est.)
comparison ranking: total emissions 194
Energy consumption per capita: 6.955 million Btu/person (2019 est.)
comparison ranking: 165
COMMUNICATIONS
Telephones - fixed lines: total subscriptions: 7,000 (2021 est.)
subscriptions per 100 inhabitants: (2021 est.) less than 1
comparison ranking: total subscriptions 198
Telephones - mobile cellular: total subscriptions: 470,000 (2021 est.)
subscriptions per 100 inhabitants: 67 (2021 est.)
comparison ranking: total subscriptions 175
Telecommunication systems: general assessment: mobile services have continually expanded in the Solomon Islands; 3G services became available in 2010, leading to an increase in mobile broadband uptake; Solomon Islands currently host three ISPs; fixed broadband services are largely limited to government, corporations, and educational organizations in the Solomon Islands; telecommunication infrastructure in the Solomon Islands requires significant investment due to the geographical make-up of the islands; this presents a great challenge to rural connectivity in the country; although various international organizations such as the World Bank and the Asian Development Bank have taken a special interest in having communication services improved in both the Solomon Islands and the Pacific region in general, internet and broadband penetration remain low; the provision of broadband infrastructure, particularly to rural areas, is also hindered by land disputes; internet services have, improved with the build-out of the Coral Sea Cable System linking Papua New Guinea to the Solomon Islands, as also with a connecting cable to a landing station at Sydney; the Australian government provided most of the funding for the Coral Sea Cable System, with contributions and support from the Solomon Islands and Papua New Guinea governments; the launch of the Kacific-1 satellite in late 2019 also improved broadband satellite capacity for the region, though for telcos in Solomon Islands satellite services are now largely used as backup for international traffic; in recent years, the country has stabilized both politically and economically and this, along with improvements to mobile infrastructure, has led to a rise in mobile services and the slow uptake of broadband services; while the first LTE services were launched in late 2017 in the capital Honiara, the main platform for mobile voice and data services remains 3G, while in outlying areas GSM is still an important technology for the provision of services (2022)
domestic: fixed-line is less than 1 per 100 persons and mobile-cellular telephone density 67 per 100 persons (2021)
international: country code - 677; landing points for the CSCS and ICNS2 submarine cables providing connectivity from Solomon Islands, to PNG, Vanuatu and Australia; satellite earth station - 1 Intelsat (Pacific Ocean) (2019)
Broadcast media: Solomon Islands Broadcasting Corporation (SIBC) does not broadcast television; multi-channel pay-TV is available; SIBC operates 2 national radio stations and 2 provincial stations; there are 2 local commercial radio stations; Radio Australia is available via satellite feed (since 2009) (2019)
Internet country code: .sb
Internet users: total: 255,600 (2021 est.)
percent of population: 36% (2021 est.)
comparison ranking: total 175
Broadband - fixed subscriptions: total: 1,000 (2020 est.)
subscriptions per 100 inhabitants: 0.2 (2020 est.)
comparison ranking: total 206
TRANSPORTATION
National air transport system: number of registered air carriers: 1 (2020)
inventory of registered aircraft operated by air carriers: 6
annual passenger traffic on registered air carriers: 427,806 (2018)
annual freight traffic on registered air carriers: 3.84 million (2018) mt-km
Civil aircraft registration country code prefix: H4
Airports: 36 (2021)
comparison ranking: total 108
Airports - with paved runways: 1
note: paved runways have a concrete or asphalt surface but not all have facilities for refueling, maintenance, or air traffic control; the length of a runway required for aircraft to safely operate depends on a number of factors including the type of aircraft, the takeoff weight (including passengers, cargo, and fuel), engine types, flap settings, landing speed, elevation of the airport, and average maximum daily air temperature; paved runways can reach a length of 5,000 m (16,000 ft.), but the “typical” length of a commercial airline runway is between 2,500-4,000 m (8,000-13,000 ft.)
Airports - with unpaved runways: 35
note: unpaved runways have a surface composition such as grass or packed earth and are most suited to the operation of light aircraft; unpaved runways are usually short, often less than 1,000 m (3,280 ft.) in length; airports with unpaved runways often lack facilities for refueling, maintenance, or air traffic control
Heliports: 3 (2021)
Roadways: total: 1,390 km (2011)
paved: 34 km (2011)
unpaved: 1,356 km (2011)
note: includes 920 km of private plantation roads
comparison ranking: total 175
Merchant marine: total: 27 (2022)
by type: general cargo 9, oil tanker 1, other 17
comparison ranking: total 138
Ports and terminals: major seaport(s): Honiara, Malloco Bay, Viru Harbor, Tulagi
MILITARY AND SECURITY
Military and security forces: no regular military forces; the Royal Solomon Islands Police Force is responsible for internal and external security and reports to the Ministry of Police, National Security, and Correctional Services (2023)
Military equipment inventories and acquisitions: China and Australia have provided equipment to the Solomons Islands Police Force; the maritime branch operates patrol boats provided by Australia (2023)
Military - note: Australia and New Zealand provide material and training assistance to the Royal Solomon Islands Police Force (2023)
TRANSNATIONAL ISSUES
Disputes - international: from 2003 to 2017, at the request of the Solomon Islands Governor-General, the Regional Assistance Mission to Solomon Islands (RAMSI), consisting of police, military, and civilian advisors drawn from 15 countries, assisted in reestablishing and maintaining civil and political order while reinforcing regional stability and security
Trafficking in persons: tier rating: Tier 2 Watch List — Solomon Islands does not fully meet the minimum standards for the elimination of trafficking but is making significant efforts to do so; these efforts included developing a communication and implementation strategy for its National Action Plan and raising awareness of trafficking; however, the government did not demonstrate overall increasing efforts, compared with the previous reporting period, to expand its anti-trafficking capacity; authorities did not identify or assist victims, and protection services remained inadequate; officials did not initiate any trafficking investigations or prosecutions and, for the third consecutive year, did not convict any traffickers; the government did not conduct anti-trafficking training for its police or judicial officials who lack an understanding of trafficking; for the fourth consecutive year, authorities did not conduct systematic monitoring and inspection activities at logging sites or in the fishing or mining sectors, despite clear indicators of trafficking; therefore, Solomon Islands was downgraded to Tier 2 Watch List (2023)
trafficking profile: human traffickers exploit domestic and foreign victims in Solomon Islands, and traffickers exploit Solomon Islanders abroad; traffickers also use Solomon Islands as a transit point to move victims to other countries; local, South Asian, and Southeast Asian men and women are exploited in labor and sex trafficking in Solomon islands; local children are especially vulnerable to labor and sex trafficking; women from China, Indonesia, Malaysia, and the Philippines often pay large recruitment fees for jobs in Solomon Islands but are forced or coerced into commercial sex upon arrival; men from Indonesia and Malaysia are exploited in the logging, fishing, palm oil, and mining industries, while fisherman from Fiji, Indonesia, North Korea, the Philippines, Sri Lanka, and Vietnam are at risk of exploitation on Taiwan-flagged vessels in Solomon Islands’ territorial waters; Chinese workers may be forced to work for Chinese companies in Solomon Islands; women and girls may be at risk of debt-based coercion in sex trafficking and domestic servitude; some official corruption may facilitate trafficking through irregular migration and involvement in the fishing and forestry sectors; some boys, girls, and young women are recruited for domestic work but then exploited in commercial sex at logging camps; Solomon Islander children may be exploited in labor trafficking in the agricultural sector, forced harvesting of seafood, and forced criminality in drug production and transportation and pickpocketing; widespread social stigma against LGBTQI+ individuals increases their vulnerability to trafficking (2023)
SOMALIA
INTRODUCTION
Background: Ancient Egypt trade expeditions along the northeastern coast of Africa - including today’s Eritrea, Djibouti, and Somalia - occurred at various times between the 25th and 12th centuries B.C. Between A.D. 800 and 1100, immigrant Muslim Arabs and Persians set up coastal trading posts along the Gulf of Aden and the Indian Ocean, solidifying Somalia’s close trading relationship with the Arab Peninsula. In the late 19th century, Britain and Italy established colonies in the Somali Peninsula, where they remained until 1960, when British Somaliland gained independence and joined with Italian Somaliland to form the Republic of Somalia. The country functioned as a parliamentary democracy until 1969, when General Mohamed SIAD Barre took control in a coup, beginning a 22-year authoritarian socialist dictatorship. In an effort to centralize power, SIAD called for the eradication of the clan, the key cultural and social organizing principle in Somali society. Resistance to SIAD’s socialist leadership, which was causing a rapid deterioration of the country, prompted allied clan militias to overthrow SIAD in early 1991, resulting in state collapse. Subsequent fighting between rival clans for resources and territory overwhelmed the country, resulting in a manmade famine and prompting international intervention. Beginning in 1993, the UN spearheaded a humanitarian mission supported by international forces, but the international community largely withdrew by 1995 following an incident that became known as Black Hawk Down in which two American Sikorsky UH-60 Black Hawk helicopters were shot down in Mogadishu. The fighting and subsequent siege and rescue resulted in 21 deaths and 82 wounded among the international forces.
International peace conferences in the 2000s resulted in a number of transitional governments that operated outside of Somalia. Left largely to themselves, Somalis in the country established alternative governance structures; some areas formed their own administrations, such as Somaliland and Puntland, while others developed localized institutions. Many local populations turned to using sharia courts, an Islamic judicial system that implements religious law. Several of these courts came together in 2006 to form the Islamic Courts Union (ICU). The ICU established order in many areas of central and southern Somalia, including Mogadishu, but was forced out when Ethiopia intervened militarily in December 2006 on behalf of the Somali Transitional Federal Government (TFG). While the TFG settled in the capital, the ICU fled to rural areas or from Somalia altogether, reemerging less than a year later as the Islamic insurgent and terrorist movement al-Shabaab, which is still active today. In January 2007, the African Union (AU) established the AU Mission in Somalia peacekeeping force, which allowed Ethiopia to withdraw its forces, took over security responsibility for the country, and gave the TFG space to develop Somalia’s new government. By 2012, Somali powerbrokers agreed on a provisional constitution with a loose federal structure and established a central government in Mogadishu termed the Somali Federal Government (SFG). Since then, several interim regional administrations have been established and there have been two presidential elections. However, significant and fundamental governance and security problems remain for the SFG since al-Shabaab controls large portions of the country.
GEOGRAPHY
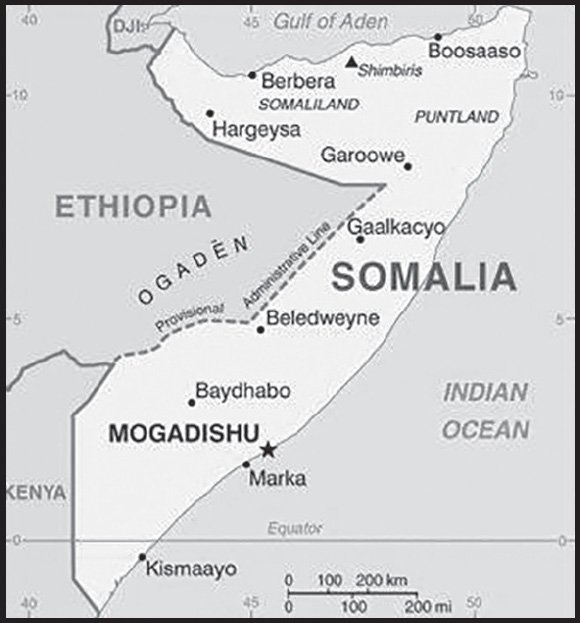
Location: Eastern Africa, bordering the Gulf of Aden and the Indian Ocean, east of Ethiopia
Geographic coordinates: 10 00 N, 49 00 E
Map references: Africa
Area: total: 637,657 sq km
land: 627,337 sq km
water: 10,320 sq km
comparison ranking: total 46
Area - comparative: almost five times the size of Alabama; slightly smaller than Texas
Land boundaries: total: 2,385 km
border countries (3): Djibouti 61 km; Ethiopia 1,640 km; Kenya 684 km
Coastline: 3,025 km
Maritime claims: territorial sea: 200 nm; note: the US does not recognize this claim
exclusive economic zone: 200 nm
Climate: principally desert; northeast monsoon (December to February), moderate temperatures in north and hot in south; southwest monsoon (May to October), torrid in the north and hot in the south, irregular rainfall, hot and humid periods (tangambili) between monsoons
Terrain: mostly flat to undulating plateau rising to hills in north
Elevation: highest point: Mount Shimbiris 2,460 m
lowest point: Indian Ocean 0 m
mean elevation: 410 m
Natural resources: uranium and largely unexploited reserves of iron ore, tin, gypsum, bauxite, copper, salt, natural gas, likely oil reserves
Land use: agricultural land: 70.3% (2018 est.)
arable land: 1.8% (2018 est.)
permanent crops: 0% (2018 est.)
permanent pasture: 68.5% (2018 est.)
forest: 10.6% (2018 est.)
other: 19.1% (2018 est.)
Irrigated land: 2,000 sq km (2012)
Major aquifers: Ogaden-Juba Basin
Population distribution: distribution varies greatly throughout the country; least densely populated areas are in the northeast and central regions, as well as areas along the Kenyan border; most populated areas are in and around the cities of Mogadishu, Marka, Boorama, Hargeysa, and Baidoa as shown on this population distribution map
Natural hazards: recurring droughts; frequent dust storms over eastern plains in summer; floods during rainy season
Geography - note: strategic location on Horn of Africa along southern approaches to Bab el Mandeb and route through Red Sea and Suez Canal
PEOPLE AND SOCIETY
Population: 12,693,796 (2023 est.)
note: this estimate was derived from an official census taken in 1975 by the Somali Government; population counting in Somalia is complicated by the large number of nomads and by refugee movements in response to famine and clan warfare
comparison ranking: 78
Nationality: noun: Somali(s)
adjective: Somali
Ethnic groups: Somali 85%, Bantu and other non-Somali 15% (including 30,000 Arabs)
Languages: Somali (official, according to the 2012 Transitional Federal Charter), Arabic (official, according to the 2012 Transitional Federal Charter), Italian, English
major-language sample(s):
Buugga Xaqiiqda Aduunka, waa laga maarmaanka macluumaadka assasiga. (Somali)
Religions: Sunni Muslim (Islam) (official, according to the 2012 Transitional Federal Charter)
Demographic profile: Somalia scores very low for most humanitarian indicators, suffering from poor governance, protracted internal conflict, underdevelopment, economic decline, poverty, social and gender inequality, and environmental degradation. Despite civil war and famine raising its mortality rate, Somalia’s high fertility rate and large proportion of people of reproductive age maintain rapid population growth, with each generation being larger than the prior one. More than 60% of Somalia’s population is younger than 25 as of 2020, and the fertility rate is among the world’s highest at almost 5.5 children per woman – a rate that has decreased little since the 1970s.
A lack of educational and job opportunities is a major source of tension for Somalia’s large youth cohort, making them vulnerable to recruitment by extremist and pirate groups. Somalia has one of the world’s lowest primary school enrollment rates – just over 40% of children are in school – and one of the world’s highest youth unemployment rates. Life expectancy is low as a result of high infant and maternal mortality rates, the spread of preventable diseases, poor sanitation, chronic malnutrition, and inadequate health services.
During the two decades of conflict that followed the fall of the SIAD regime in 1991, hundreds of thousands of Somalis fled their homes. Today Somalia is the world’s fourth highest source country for refugees, after Ukraine, Syria and Afghanistan. Insecurity, drought, floods, food shortages, and a lack of economic opportunities are the driving factors.
As of 2022, more than 660,000 Somali refugees were hosted in the region, mainly in Kenya, Yemen, Egypt, Ethiopia, Djibouti, and Uganda, while nearly 3 million Somalis were internally displaced. Since the implementation of a tripartite voluntary repatriation agreement among Kenya, Somalia, and the UNHCR in 2013, many Somali refugees have returned home, some 80,000 between 2014 and 2022. The Kenyan Government in March 2021 ordered the closure of its two largest refugee camps, Dadaab and Kakuma, which then hosted more than 410,000 mainly Somali refugees. However, the UN refugee agency presented a road map, including voluntary repatriation, relocation to third countries, and alternative stay options that persuaded the Kenyan Government to delay the closures. The plan was supposed to lead to both camps being closed by 30 June 2022. Yet, as of May 2022, few Somali refugees had decided to return home because of security concerns and the lack of job prospects, instead waiting in the camps unsure of what the future held for them. Other Somali asylum seekers brave the dangers of crossing the Gulf of Aden to reach Yemen – despite its internal conflict – with aspirations to move onward to Saudi Arabia and other locations.
Age structure: 0-14 years: 41.54% (male 2,633,262/female 2,640,088)
15-64 years: 55.77% (male 3,609,721/female 3,469,735)
65 years and over: 2.69% (2023 est.) (male 143,742/female 197,248)
Dependency ratios: total dependency ratio: 99.4
youth dependency ratio: 94.2
elderly dependency ratio: 5.2
potential support ratio: 19.3 (2021 est.)
Median age: total: 19 years (2023 est.)
male: 19.2 years
female: 18.7 years
comparison ranking: total 211
Population growth rate: 2.49% (2023 est.)
comparison ranking: 21
Birth rate: 37.7 births/1,000 population (2023 est.)
comparison ranking: 8
Death rate: 11.4 deaths/1,000 population (2023 est.)
comparison ranking: 23
Net migration rate: -1.4 migrant(s)/1,000 population (2023 est.)
comparison ranking: 156
Population distribution: distribution varies greatly throughout the country; least densely populated areas are in the northeast and central regions, as well as areas along the Kenyan border; most populated areas are in and around the cities of Mogadishu, Marka, Boorama, Hargeysa, and Baidoa as shown on this population distribution map
Urbanization: urban population: 47.9% of total population (2023)
rate of urbanization: 4.2% annual rate of change (2020-25 est.)
Major urban areas - population: 2.610 million MOGADISHU (capital), 1.127 million Hargeysa (2023)
Sex ratio: at birth: 1.03 male(s)/female
0-14 years: 1 male(s)/female
15-64 years: 1.04 male(s)/female
65 years and over: 0.73 male(s)/female
total population: 1.01 male(s)/female (2023 est.)
Maternal mortality ratio: 621 deaths/100,000 live births (2020 est.)
comparison ranking: 7
Infant mortality rate: total: 85.1 deaths/1,000 live births (2023 est.)
male: 94.7 deaths/1,000 live births
female: 75.2 deaths/1,000 live births
comparison ranking: total 2
Life expectancy at birth: total population: 56.1 years (2023 est.)
male: 53.8 years
female: 58.6 years
comparison ranking: total population 225
Total fertility rate: 5.22 children born/woman (2023 est.)
comparison ranking: 8
Gross reproduction rate: 2.57 (2023 est.)
Contraceptive prevalence rate: 6.9% (2018/19)
Drinking water source: improved: urban: 96.4% of population
rural: 73.7% of population
total: 84.2% of population
unimproved: urban: 3.6% of population
rural: 26.3% of population
total: 15.8% of population (2020 est.)
Physicians density: 0.02 physicians/1,000 population (2014)
Hospital bed density: 0.9 beds/1,000 population (2017)
Sanitation facility access: improved: urban: 82.4% of population
rural: 33.8% of population
total: 56.2% of population
unimproved: urban: 17.6% of population
rural: 66.2% of population
total: 43.8% of population (2020 est.)
Major infectious diseases: degree of risk: very high (2023)
food or waterborne diseases: bacterial and protozoal diarrhea, hepatitis A and E, and typhoid fever
vectorborne diseases: dengue fever, malaria, and Rift Valley fever
water contact diseases: schistosomiasis
animal contact diseases: rabies
note: on 31 August 2023, the US Centers for Disease Control and Prevention (CDC) issued a Travel Alert for polio in Africa; Somalia is currently considered a high risk to travelers for circulating vaccine-derived polioviruses (cVDPV); vaccine-derived poliovirus (VDPV) is a strain of the weakened poliovirus that was initially included in oral polio vaccine (OPV) and that has changed over time and behaves more like the wild or naturally occurring virus; this means it can be spread more easily to people who are unvaccinated against polio and who come in contact with the stool or respiratory secretions, such as from a sneeze, of an “infected” person who received oral polio vaccine; the CDC recommends that before any international travel, anyone unvaccinated, incompletely vaccinated, or with an unknown polio vaccination status should complete the routine polio vaccine series; before travel to any high-risk destination, the CDC recommends that adults who previously completed the full, routine polio vaccine series receive a single, lifetime booster dose of polio vaccine
Obesity - adult prevalence rate: 8.3% (2016)
comparison ranking: 153
Alcohol consumption per capita: total: 0 liters of pure alcohol (2019 est.)
beer: 0 liters of pure alcohol (2019 est.)
wine: 0 liters of pure alcohol (2019 est.)
spirits: 0 liters of pure alcohol (2019 est.)
other alcohols: 0 liters of pure alcohol (2019 est.)
comparison ranking: total 188
Currently married women (ages 15-49): 62.9% (2023 est.)
Child marriage: women married by age 15: 16.8%
women married by age 18: 35.5%
men married by age 18: 5.6% (2020 est.)
Education expenditures: 0.3% of GDP (2019)
comparison ranking: 197
Youth unemployment rate (ages 15-24): total: 34.7% (2021 est.)
male: 32.5%
female: 38.5%
comparison ranking: total 26
ENVIRONMENT
Environment - current issues: water scarcity; contaminated water contributes to human health problems; improper waste disposal; deforestation; land degradation; overgrazing; soil erosion; desertification
Environment - international agreements: party to: Biodiversity, Climate Change, Climate Change-Kyoto Protocol, Climate Change-Paris Agreement, Desertification, Endangered Species, Hazardous Wastes, Law of the Sea, Ozone Layer Protection
signed, but not ratified: Nuclear Test Ban
Climate: principally desert; northeast monsoon (December to February), moderate temperatures in north and hot in south; southwest monsoon (May to October), torrid in the north and hot in the south, irregular rainfall, hot and humid periods (tangambili) between monsoons
Land use: agricultural land: 70.3% (2018 est.)
arable land: 1.8% (2018 est.)
permanent crops: 0% (2018 est.)
permanent pasture: 68.5% (2018 est.)
forest: 10.6% (2018 est.)
other: 19.1% (2018 est.)
Urbanization: urban population: 47.9% of total population (2023)
rate of urbanization: 4.2% annual rate of change (2020-25 est.)
Food insecurity: exceptional shortfall in aggregate food production/supplies: due to drought conditions and internal conflict - about 6.5 million people are estimated to face severe acute food insecurity between April and June 2023 as a result of consecutive poor rainy seasons since late 2020 and heightened conflict since early 2021 (2023)
Air pollutants: particulate matter emissions: 14.28 micrograms per cubic meter (2019 est.)
carbon dioxide emissions: 0.65 megatons (2016 est.)
methane emissions: 20.13 megatons (2020 est.)
Waste and recycling: municipal solid waste generated annually: 2,326,099 tons (2016 est.)
Major aquifers: Ogaden-Juba Basin
Total water withdrawal: municipal: 20 million cubic meters (2020 est.)
industrial: 2 million cubic meters (2017 est.)
agricultural: 3.28 billion cubic meters (2020 est.)
Total renewable water resources: 14.7 billion cubic meters (2020 est.)
GOVERNMENT
Country name: conventional long form: Federal Republic of Somalia
conventional short form: Somalia
local long form: Jamhuuriyadda Federaalka Soomaaliya (Somali)/ Jumhuriyat as Sumal al Fidiraliyah (Arabic)
local short form: Soomaaliya (Somali)/ As Sumal (Arabic)
former: British Somaliland, Italian Somaliland, Somali Republic, Somali Democratic Republic
etymology: “Land of the Somali” (ethnic group)
Government type: federal parliamentary republic
Capital: name: Mogadishu
geographic coordinates: 2 04 N, 45 20 E
time difference: UTC+3 (8 hours ahead of Washington, DC, during Standard Time)
etymology: several theories attempt to explain the city’s name; one of the more plausible is that it derives from “maq’ad-i-shah” meaning “the seat of the shah,” reflecting the city’s links with Persia
Administrative divisions: 18 regions (plural - gobollo, singular - gobol); Awdal, Bakool, Banaadir, Bari, Bay, Galguduud, Gedo, Hiiraan, Jubbada Dhexe (Middle Jubba), Jubbada Hoose (Lower Jubba), Mudug, Nugaal, Sanaag, Shabeellaha Dhexe (Middle Shabeelle), Shabeellaha Hoose (Lower Shabeelle), Sool, Togdheer, Woqooyi Galbeed
Independence: 1 July 1960 (from a merger of British Somaliland, which became independent from the UK on 26 June 1960, and Italian Somaliland, which became independent from the Italian-administered UN trusteeship on 1 July 1960 to form the Somali Republic)
National holiday: Foundation of the Somali Republic, 1 July (1960); note - 26 June (1960) in Somaliland
Constitution: history: previous 1961, 1979; latest drafted 12 June 2012, adopted 1 August 2012 (provisional)
amendments: proposed by the federal government, by members of the state governments, the Federal Parliament, or by public petition; proposals require review by a joint committee of Parliament with inclusion of public comments and state legislatures’ comments; passage requires at least two-thirds majority vote in both houses of Parliament and approval by a majority of votes cast in a referendum; constitutional clauses on Islamic principles, the federal system, human rights and freedoms, powers and authorities of the government branches, and inclusion of women in national institutions cannot be amended; note - in late December 2020, the president signed a decree blocking the approval of amendments
Legal system: mixed legal system of civil law, Islamic (sharia) law, and customary law (referred to as Xeer)
International law organization participation: accepts compulsory ICJ jurisdiction with reservations; non-party state to the ICCt
Citizenship: citizenship by birth: no
citizenship by descent only: the father must be a citizen of Somalia
dual citizenship recognized: no
residency requirement for naturalization: 7 years
Suffrage: 18 years of age; universal
Executive branch: chief of state: President HASSAN SHEIKH Mohamud (since 23 May 2022)
head of government: Prime Minister Hamza Abdi BARRE (since 25 June 2022)
cabinet: Cabinet appointed by the prime minister, approved by the House of the People
elections/appointments: president indirectly elected by the Federal Parliament by two-thirds majority vote in 2 rounds if needed for a single 4-year term; election last held on 15 May 2022 (next to be held in 2026); prime minister appointed by the president, approved by the House of the People; note - elections were originally scheduled for 10 October 2021 but did not take place; on 13 April 2022, the election of the House of the People representatives was completed and the presidential election date was set for 15 May 2022
election results:
2022: HASSAN SHEIKH Mohamud elected president in third round - Federal Parliament percent of vote in first round - Said ABDULLAHI DENI (Kaah) 20.2%, Mohamed ABDULLAHI Mohamed “Farmaajo” (TPP) 18.3%, HASSAN SHEIKH Mohamud (PDP) 16.2%, Hassan Ali KHAYRE (independent) 14.6%, other 30.7%; Federal Parliament percent of vote in second round - HASSAN SHEIKH Mohamud 34.1%, Mohamed ABDULLAHI Mohamed “Farmaajo” 25.7%, Said ABDULLAHI DENI 21%, Hassan Ali KHAYRE 19.2%; Federal Parliament percent of vote in third round - HASSAN SHEIKH Mohamud 66%, Mohamed ABDULLAHI Mohamed “Farmaajo” 34%
2017: Mohamed ABDULLAHI Mohamed “Farmaajo” elected president in second round; Federal Parliament number of votes in first round - HASSAN SHEIKH Mohamud (PDP) 88, Mohamed ABDULLAHI Mohamed “Farmaajo” (TPP) 72, Sheikh SHARIF Sheikh Ahmed (ARS) 49, other 37; Federal Parliament number of votes in second round - Mohamed ABDULLAHI Mohamed “Farmaajo” 184, HASSAN SHEIKH Mohamud 97, Sheikh SHARIF Sheikh Ahmed 45
Legislative branch: description: bicameral Federal Parliament to consist of:
Senate (54 seats; senators indirectly elected by state assemblies to serve 4-year terms)
House of the People (275 seats; members indirectly elected by electoral colleges, each consisting of 51 delegates selected by the 136 Traditional Elders in consultation with sub-clan elders; members serve 4-year terms)
elections: Senate - first held on 10 October 2016; last held 27 July - 13 November 2021 (next to be held in 2024) House of the People - first held 23 October - 10 November 2016 (next scheduled for September - October 2021 but postponed to November 2021 and then extended numerous times until April 2022; next to be held in 2024)
election results: Senate - percent of vote by party - NA; seats by party - NA; composition - men 40, women 14, percent of women 25.9%
House of the People - percent of vote by party - NA; seats by party - NA; composition - men 225, women 50, percent of women 22.2%; note - total Parliament percent of women 19.5%
note 1: the inaugural House of the People was appointed in September 2012 by clan elders; in 2016 and 2017, the Federal Parliament became bicameral with indirect elections scheduled for 10 October 2016 for the Upper House - renamed ‘Senate’ and 23 October to 10 November 2016 for the House of the People; while the elections were delayed, they were eventually held in most regions despite voting irregularities; on 27 December 2016, 41 Upper House senators and 242 House of the People Members of Parliament (MP) were sworn in
note 2: despite the formation of political parties in 2020, the 2021 parliamentary elections maintained a primarily clanbased system of appointments; seats in the legislature were apportioned to Somali member states and not by party representation
Judicial branch: highest court(s): the provisional constitution stipulates the establishment of the Constitutional Court (consists of 5 judges, including the chief judge and deputy chief judge); note - under the terms of the 2004 Transitional National Charter, a Supreme Court based in Mogadishu and the Appeal Court were established; yet most regions have reverted to local forms of conflict resolution, either secular, traditional Somali customary law, or Islamic law
judge selection and term of office: judges appointed by the president upon proposal of the Judicial Service Commission, a 9-member judicial and administrative body; judge tenure NA
subordinate courts: federal courts; federal member state-level courts; military courts; sharia courts
Political parties and leaders: select National Independent Electoral Commission (NIEC) approved parties (as of 2020):
Cosmopolitan Democratic Party [Yarow Sharef ADEN]
Green Party [Ahmed HAJI]
Himilo Qaran Party [Sharif SHEIKH AHMED]
Ilays Party [Abdulkadir OSOBLE]
Justice and Reconciliation Party
National Progressive Party
Peace and Unity Party [Asha ABDALLA]
Qaransoor Party [Abdijabaar SHEIKH AHMED]
Qiimo Qaran Party
Security and Justice Party
Social Justice Party [Mohamed NUR, chairman]
Somali Labour Party[Ali Mohamed APOLLO, chairman]
Somali Republic Party [Abdinur Ahmed DARMAN, chairman]
Somali Social Unity Party or SSUP [Yaasiin Maaxi MACALIN]
Union for Peace and Development Party or PDP [HASSAN SHEIKH Mohamud]
Wadajir Party [Abdirahman Abdishakur WARSAME]
note: in 2017 an independent electoral commission (the NIEC) was inaugurated with a mandate to oversee the process of registration of political parties in the country; as of 2021, the NIEC had registered a total of 110 parties
International organization participation: ACP, AfDB, AFESD, AMF, AU, CAEU (candidate), EAC, FAO, G-77, IBRD, ICAO, ICRM, IDA, IDB, IFAD, IFC, IFRCS, IGAD, ILO, IMF, IMO, Interpol, IOC, IOM, IPU, ITSO, ITU, LAS, NAM, OIC, OPCW, OPCW (signatory), UN, UNCTAD, UNESCO, UNHCR, UNHRC, UNIDO, UPU, WFTU (NGOs), WHO, WIPO, WMO
Diplomatic representation in the US: chief of mission: Ambassador Ali Sharif AHMED (since 16 September 2019)
chancery: 1609 22nd Street NW, Washington, DC 20008
telephone: [1] (202) 853-9164
email address and website:
Diplomatic representation from the US: chief of mission: Ambassador (vacant); Chargé d’Affaires Shane L. DIXON (since 25 July 2023)
embassy: Mogadishu, (reopened October 2019 on the grounds of the Mogadishu Airport)
mailing address: P.O. Box 606 Village Market
00621 Nairobi, Kenya
telephone: [254] 20 363-6451
email address and website:
Flag description: light blue with a large white five-pointed star in the center; the blue field was originally influenced by the flag of the UN but today is said to denote the sky and the neighboring Indian Ocean; the five points of the star represent the five regions in the horn of Africa that are inhabited by Somali people: the former British Somaliland and Italian Somaliland (which together make up Somalia), Djibouti, Ogaden (Ethiopia), and the North East Province (Kenya)
National symbol(s): leopard; national colors: blue, white
National anthem: name: “Qolobaa Calankeed” (Every Nation Has its own Flag)
lyrics/music: lyrics/music: Abdullahi QARSHE
note: adopted 2012; written in 1959
Government - note: regional and local governing bodies continue to exist and control various areas of the country, including the self-declared Republic of Somaliland in northwestern Somalia
ECONOMY
Economic overview: low-income African Horn economy; 30 years of war and instability crippled economic potential; high remittances for basic survival; new fiscal federalism approach; cleared some unsustainable debt; environmentally fragile; digitally driven urbanization efforts
Real GDP (purchasing power parity): $19.399 billion (2021 est.)
$18.644 billion (2020 est.)
$18.191 billion (2019 est.)
note: data are in 2017 US dollars
comparison ranking: 154
Real GDP growth rate: 4.05% (2021 est.)
2.49% (2020 est.)
7.46% (2019 est.)
comparison ranking: 121
Real GDP per capita: $1,100 (2021 est.)
$1,100 (2020 est.)
$1,100 (2019 est.)
note: data are in 2017 dollars
comparison ranking: 227
GDP (official exchange rate): $7.052 billion (2017 est.)
Inflation rate (consumer prices): 1.5% (2017 est.)
-71.1% (2016 est.)
comparison ranking: 179
GDP - composition, by sector of origin: agriculture: 60.2% (2013 est.)
industry: 7.4% (2013 est.)
services: 32.5% (2013 est.)
comparison rankings: services 223; industry 214; agriculture 2
GDP - composition, by end use: household consumption: 72.6% (2015 est.)
government consumption: 8.7% (2015 est.)
investment in fixed capital: 20% (2015 est.)
investment in inventories: 0.8% (2016 est.)
exports of goods and services: 0.3% (2015 est.)
imports of goods and services: -1.6% (2015 est.)
Agricultural products: camel milk, milk, sheep milk, goat milk, sugar cane, fruit, sorghum, cassava, vegetables, maize Industries
light industries, including sugar refining, textiles, wireless communication
Industrial production growth rate: 3.5% (2014 est.)
comparison ranking: 111
Labor force: 3.042 million (2021 est.)
comparison ranking: 105
Labor force - by occupation: agriculture: 71%
industry: 29%
industry and services: 29% (1975)
Unemployment rate: 19.86% (2021 est.)
19.72% (2020 est.)
18.83% (2019 est.)
comparison ranking: 20
Youth unemployment rate (ages 15-24): total: 34.7% (2021 est.)
male: 32.5%
female: 38.5%
comparison ranking: total 26
Gini Index coefficient - distribution of family income: 36.8 (2017 est.)
comparison ranking: 83
Budget: revenues: $145.3 million (2014 est.)
expenditures: $151.1 million (2014 est.)
Budget surplus (+) or deficit (-): -0.1% (of GDP) (2014 est.)
comparison ranking: 50
Public debt: 76.7% of GDP (2017 est.)
93% of GDP (2014 est.)
comparison ranking: 45
Taxes and other revenues: 0% (of GDP) (2020 est.)
comparison ranking: 222
Current account balance: -$464 million (2017 est.)
-$427 million (2016 est.)
comparison ranking: 117
Exports: $819 million (2014 est.)
$779 million (2013 est.)
comparison ranking: 182
Exports - partners: United Arab Emirates 47%, Saudi Arabia 19%, India 5%, Japan 5% (2019)
Exports - commodities: gold, sheep, goats, sesame seeds, insect resins, cattle (2019)
Imports: $94.43 billion (2018 est.)
$80.07 billion (2017 est.)
comparison ranking: 47
Imports - partners: United Arab Emirates 32%, China 20%, India 17%, Turkey 7% (2019)
Imports - commodities: cigarettes, raw sugar, rice, broadcasting equipment, textiles (2019)
Reserves of foreign exchange and gold: $30.45 million (2014 est.)
comparison ranking: 194
Debt - external: $5.3 billion (31 December 2014 est.)
comparison ranking: 131
Exchange rates: Somali shillings (SOS) per US dollar -
Exchange rates:
23,960 (2016 est.)
ENERGY
Electricity access: population without electricity: 10 million (2020)
electrification - total population: 49.3% (2021)
electrification - urban areas: 70.6% (2021)
electrification - rural areas: 30.6% (2021)
Electricity: installed generating capacity: 91,000 kW (2020 est.)
consumption: 311.2 million kWh (2019 est.)
exports: 0 kWh (2019 est.)
imports: 0 kWh (2019 est.)
transmission/distribution losses: 35 million kWh (2019 est.)
comparison rankings: installed generating capacity 185; transmission/distribution losses 176; imports 124; exports 104; consumption 180
Electricity generation sources: fossil fuels: 95.3% of total installed capacity (2020 est.)
solar: 3% of total installed capacity (2020 est.)
wind: 1.7% of total installed capacity (2020 est.)
Petroleum: total petroleum production: 0 bbl/day (2021 est.)
refined petroleum consumption: 5,900 bbl/day (2019 est.)
Refined petroleum products - imports: 5,590 bbl/day (2015 est.)
comparison ranking: 167
Natural gas: proven reserves: 5.663 billion cubic meters (2021 est.)
Carbon dioxide emissions: 882,000 metric tonnes of CO2 (2019 est.)
from petroleum and other liquids: 882,000 metric tonnes of CO2 (2019 est.)
comparison ranking: total emissions 176
Energy consumption per capita: 802,000 Btu/person (2019 est.)
comparison ranking: 195
COMMUNICATIONS
Telephones - fixed lines: total subscriptions: 91,000 (2021 est.)
subscriptions per 100 inhabitants: 1 (2021 est.)
comparison ranking: total subscriptions 141
Telephones - mobile cellular: total subscriptions: 8.844 million (2021 est.)
subscriptions per 100 inhabitants: 52 (2021 est.)
comparison ranking: total subscriptions 95
Telecommunication systems: general assessment: Somalia’s economic difficulties in recent years have made it difficult for telcos and the government to sustain investment in infrastructure; the government has also had to contend with militant groups which continue on occasion to force the closure of internet services in many areas of the country; in recent years, though, the government has addressed the lack of guidance which had prevailed since 1991, when a dictatorial regime was overthrown; the National Communications Law was passed in October 2017, aimed at setting a legal and regulatory framework for the telecoms sector, while provision was made in the following year to set up a regulatory authority to oversee the telecom sector; more recently, three types of licenses were mandated to provide clarity to operators, and to bring the market closer into line with international standards; all operators were given until August 2020 to secure one of the three license types; given the poor condition of fixed-line infrastructure, operators have concentrated on mobile connectivity; their investment plans have involved the development of LTE services to provide mobile data and broadband services; the telecom market has flourished; tariffs are among the lowest in Africa, and new cable systems coming on stream in the next few years, as well as planned investments from local operators to bolster the country’s national fiber backbone, will lead to downward pressure on retail pricing; on the consumer side, spending on telecoms services and devices are under pressure from the financial effect of large-scale job losses and the consequent restriction on disposable incomes as the remnants of the impact of the Covid-19 pandemic remain and as global events, such as the Russian invasion of Ukraine, continue to play out; the market is continuing a positive growth trajectory, supported by a slow economic rebound in the country (2022)
domestic: fixed-line is 1 per 100 and mobile-cellular is 52 per 100 (2021)
international: country code - 252; landing points for the G2A, DARE1, PEACE, and EASSy fiber-optic submarine cable system linking East Africa, Indian Ocean Islands, the Middle East, North Africa and Europe (2019)
Broadcast media: 2 private TV stations rebroadcast Al-Jazeera and CNN; Somaliland has 1 government-operated TV station and Puntland has 1 private TV station; the transitional government operates Radio Mogadishu; 1 SW and roughly 10 private FM radio stations broadcast in Mogadishu; several radio stations operate in central and southern regions; Somaliland has 1 government-operated radio station; Puntland has roughly a half-dozen private radio stations; transmissions of at least 2 international broadcasters are available (2019)
Internet country code: .so
Internet users: total: 2.465 million (2021 est.)
percent of population: 14.5% (2021 est.)
comparison ranking: total 129
Broadband - fixed subscriptions: total: 119,000 (2020 est.)
subscriptions per 100 inhabitants: 1 (2020 est.)
comparison ranking: total 127
TRANSPORTATION
National air transport system: number of registered air carriers: 6 (2020)
inventory of registered aircraft operated by air carriers: 7
annual passenger traffic on registered air carriers: 4,486 (2018)
Civil aircraft registration country code prefix: 6O
Airports: 52 (2021)
comparison ranking: total 89
Airports - with paved runways: 8
note: paved runways have a concrete or asphalt surface but not all have facilities for refueling, maintenance, or air traffic control; the length of a runway required for aircraft to safely operate depends on a number of factors including the type of aircraft, the takeoff weight (including passengers, cargo, and fuel), engine types, flap settings, landing speed, elevation of the airport, and average maximum daily air temperature; paved runways can reach a length of 5,000 m (16,000 ft.), but the “typical” length of a commercial airline runway is between 2,500-4,000 m (8,000-13,000 ft.)
Airports - with unpaved runways: 44
note: unpaved runways have a surface composition such as grass or packed earth and are most suited to the operation of light aircraft; unpaved runways are usually short, often less than 1,000 m (3,280 ft.) in length; airports with unpaved runways often lack facilities for refueling, maintenance, or air traffic control
Roadways: total: 15,000 km (2018)
comparison ranking: total 124
Merchant marine: total: 4 (2022)
by type: general cargo 1, other 3
comparison ranking: total 170
Ports and terminals: major seaport(s): Berbera, Kismaayo
MILITARY AND SECURITY
Military and security forces: Somali National Armed Forces (SNAF; aka Somali National Defense Force): Land Forces (Somali National Army or SNA), Somali Navy, Somali Air Force
Ministry of Internal Security: Somali National Police (SNP, includes Coast Guard and a commando unit known as Harmacad or Cheetah)
National Security and Intelligence Agency (includes a commando/counterterrorism unit) (2023)
note 1: the Somali Navy and Air Force have only a few hundred personnel, little equipment, and are not operational
note 2: Somalia has numerous militia (“macawisley”) and regional forces operating throughout the country; these forces include ones that are clan- and warlord-based, semi-official paramilitary and special police forces (“darwish”), and externally sponsored militias
note 3: Somaliland and Puntland have separate military and security forces
Military expenditures: 6% of GDP (2021 est.)
6% of GDP (2020 est.)
5.6% of GDP (2019 est.)
6% of GDP (2018 est.)
5.9% of GDP (2017 est.)
comparison ranking: 4
Military and security service personnel strengths: estimates vary; approximately 18-20,000 regular military personnel (2023)
note 1: in January 2023, the Somali Government said the SNA would have 24,000 trained and equipped troops by 2024
note 2: as of 2022, there were estimates of up to 50,000 militia forces operating in the country
Military equipment inventories and acquisitions: the SNA is lightly armed with an inventory that includes a variety of older, secondhand equipment largely from Italy, Russia, South Africa, and the UK; in recent years, it has received small quantities of equipment as aid/donations from a variety of countries, including the US (2023)
note: in 2022, the UN voted to maintain an arms embargo on Somali in place since 1992; however, the embargo was modified to reflect the Somali Government’s progress in improving its management of weapons and ammunition; it includes allowing Somalia to import portable surface-to-air missiles, higher-caliber mortars, anti-tank guided weapons, some aircraft and vessels designed or modified for military use, and combat drones for use by its security forces and police — unless the Security Council committee monitoring sanctions objects within five working days of receiving notification from the Somali Government
Military service age and obligation: 18 is the legal minimum age for voluntary military service for men and women; conscription of men aged 18-40 and women aged 18-30 is authorized, but not currently utilized (2023)
note: in 2019, the Federal Government of Somalia renewed its commitment to end the recruitment and use of child soldiers by signing a roadmap detailing measures and practical actions to prevent violations against children, release children associated with armed forces, and reintegrate them into communities; the signing followed a similar accord committed to ending the use of child soldiers signed by both the Somali Transitional Government and the UN in 2012
Military - note: the Somali National Army (SNA) and supporting security and militia forces are actively conducting operations against the al-Shabaab terrorist group (see Appendix T); al-Shabaab controls large parts of southern and central Somalia
of the SNA’s approximately 13 brigades, the most effective are assessed to be the US-trained Danab (“Lightning”) Advanced Infantry Brigade and those of the Turkish-trained Gorgor (“Eagle”) Special Division; as of 2022, the Danab Brigade numbered about 1,500 troops with an eventual projected strength of 3,000, while the Gorgor Division was estimated to have up to 5,000 trained troops; the Somali Government has sent thousands of troops to Eritrea and Uganda for training and in 2023 announced plans to send additional personnel to Egypt and Ethiopia for training
the African Union Mission in Somalia (AMISOM) operated in the country with the approval of the UN from 2007-2022; its peacekeeping mission included assisting Somali forces in providing security for a stable political process, enabling the gradual handing over of security responsibilities from AMISOM to the Somali security forces, and reducing the threat posed by al-Shabaab and other armed opposition groups; in April 2022, AMISOM was reconfigured and replaced with the AU Transition Mission in Somalia (ATMIS); the ATMIS mission is to support the Somalia Federal Government (FGS) in implementing the security objectives of the FGS’s security transition plan, a comprehensive strategy developed by the FGS and its international partners in 2018 and updated in 2021 to gradually transfer security responsibilities from ATMIS to Somali security forces; originally about 20,000-strong (civilians, military, and police), ATMIS began reducing its staffing levels in mid-2023; its planned departure from Somalia is the end of 2024
UN Assistance Mission in Somalia (UNSOM; established 2013) is mandated by the Security Council to work with the FGS to support national reconciliation, provide advice on peace-building and state-building, monitor the human rights situation, and help coordinate the efforts of the international community; the UN Support Office in Somalia (UNSOS; established 2015) is responsible for providing logistical field support to ATMIS, UNSOM, and the Somali security forces on joint operations with ATMIS
the European Union Training Mission in Somalia (EUTM-S) has operated in the country since 2010; the EUTM provides advice and training to the Somali military; the US, UK, and Turkey maintain separate military training missions in Somalia (the US has also supported the SNA with air strikes); the UAE maintains a military presence in Somaliland (2023)
TERRORISM
Terrorist group(s): Terrorist group(s): al-Shabaab; Islamic State of Iraq and ash-Sham – Somalia
note: details about the history, aims, leadership, organization, areas of operation, tactics, targets, weapons, size, and sources of support of the group(s) appear(s) in Appendix-T
TRANSNATIONAL ISSUES
Disputes - international: Somalia-Djibouti: none identified
Somalia-Ethiopia: Ethiopian forces invaded southern Somalia and routed Islamist Courts from Mogadishu in January 2007; the border between the Ogaden region of eastern Ethiopia, which is inhabited by ethnic Somalis, and Somalia is only partially demarcated under colonial rule and has been the source of tension for decades
Somalia-Kenya: Kenya works hard to prevent the clan and militia fighting in Somalia from spreading south across the border, which has long been open to nomadic pastoralists; in 2015, the Kenyan Government began building a wall along the border to prevent the crossborder movement of militant groups; the boundary separates ethnic Somalis; in October 2021, the Somalia-Kenya Indian Ocean boundary dispute was decided by the International Court of Justice; the ruling adjusted the boundary slightly north of Somalia’s claim giving Somalia the majority of the contested maritime territory, which is believed to contain rich oil and natural gas deposits; while the decision is legally binding, it has no enforcement mechanism, and Kenya has said it will not abide by it
Refugees and internally displaced persons: refugees (country of origin): 23,364 (Ethiopia), 9,969 (Yemen) (2023)
IDPs: 3.864 million (civil war since 1988, clan-based competition for resources; famine; insecurity because of fighting between al-Shabaab and the Transitional Federal Government’s allied forces) (2022)
SOUTH AFRICA
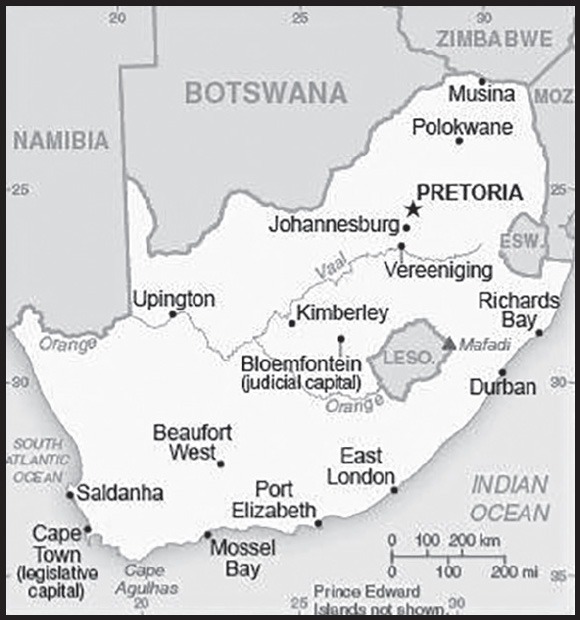
INTRODUCTION
Background: Some of the earliest human remains in the fossil record are found in South Africa. By about A.D. 500, Bantu speaking groups began settling into what is now northeastern South Africa displacing Khoisan speaking groups to the southwest. Dutch traders landed at the southern tip of present-day South Africa in 1652 and established a stopover point on the spice route between the Netherlands and the Far East, founding the city of Cape Town. After the British seized the Cape of Good Hope area in 1806, many of the settlers of Dutch descent (Afrikaners, also called “Boers” (farmers) at the time) trekked north to found their own republics, Transvaal and Orange Free State. In the 1820s, several decades of wars began as the Zulus expanded their territory, moving out of what is today southeastern South Africa and clashing with other indigenous peoples and with expanding European settlements during a period known as the Mfecane. The discovery of diamonds (1867) and gold (1886) spurred wealth and immigration from Europe.
The Anglo-Zulu War (1879) resulted in the incorporation of the Zulu kingdom’s territory into the British Empire. Subsequently, the Afrikaner republics were incorporated into the British Empire after their defeat in the Second South African War (1899-1902). However, the British and the Afrikaners ruled together beginning in 1910 under the Union of South Africa, which became a republic in 1961 after a Whites-only referendum. In 1948, the National Party was voted into power and instituted a policy of apartheid – billed as “separate development” of the races - which favored the White minority and suppressed the Black majority and other non-White groups. The African National Congress (ANC) led the resistance to apartheid and many top ANC leaders, such as Nelson MANDELA, spent decades in South Africa’s prisons. Internal protests and insurgency, as well as boycotts by some Western nations and institutions, led to the regime’s eventual willingness to unban the ANC and negotiate a peaceful transition to majority rule.
The first multi-racial elections in 1994 following the end of apartheid ushered in majority rule under an ANC-led government. South Africa has since struggled to address apartheid-era imbalances in wealth, housing, education, and health care under successive administrations. Jacob ZUMA became president in 2009 and was reelected in 2014, but resigned in February 2018 after numerous corruption scandals and gains by opposition parties in municipal elections in 2016. His successor, Cyril RAMAPHOSA, has made some progress in reigning in corruption, though many challenges persist. In May 2019 national elections, the country’s sixth since the end of apartheid, the ANC won a majority of parliamentary seats, delivering RAMAPHOSA a five-year term. RAMAPHOSA was reelected ANC leader in 2022 ahead of national elections scheduled for 2024.
GEOGRAPHY
Location: Southern Africa, at the southern tip of the continent of Africa
Geographic coordinates: 29 00 S, 24 00 E
Map references: Africa
Area: total: 1,219,090 sq km
land: 1,214,470 sq km
water: 4,620 sq km
note: includes Prince Edward Islands (Marion Island and Prince Edward Island)
comparison ranking: total 26
Area - comparative: slightly less than twice the size of Texas
Land boundaries: total: 5,244 km
border countries (6): Botswana 1,969 km; Lesotho 1,106 km; Mozambique 496 km; Namibia 1,005 km; Eswatini 438 km; Zimbabwe 230 km
Coastline: 2,798 km
Maritime claims: territorial sea: 12 nm
contiguous zone: 24 nm
exclusive economic zone: 200 nm
continental shelf: 200 nm or to edge of the continental margin
Climate: mostly semiarid; subtropical along east coast; sunny days, cool nights
Terrain: vast interior plateau rimmed by rugged hills and narrow coastal plain
Elevation: highest point: Ntheledi (Mafadi) 3,450 m
lowest point: Atlantic Ocean 0 m
mean elevation: 1,034 m
Natural resources: gold, chromium, antimony, coal, iron ore, manganese, nickel, phosphates, tin, rare earth elements, uranium, gem diamonds, platinum, copper, vanadium, salt, natural gas
note: South Africa was the World’s leading chromite ore producer in 2022 with an output of 18,000 mt
Land use: agricultural land: 79.4% (2018 est.)
arable land: 9.9% (2018 est.)
permanent crops: 0.3% (2018 est.)
permanent pasture: 69.2% (2018 est.)
forest: 7.6% (2018 est.)
other: 13% (2018 est.)
Irrigated land: 16,700 sq km (2012)
Major rivers (by length in km): Orange (shared with Lesotho [s], and Namibia [m]) - 2,092 km; Limpoporivier (Limpopo) river source (shared with Botswana, Zimbabwe, and Mozambique [m]) - 1,800 km; Vaal [s] - 1,210 km
note – [s] after country name indicates river source; [m] after country name indicates river mouth
Major watersheds (area sq km): Atlantic Ocean drainage: Orange (941,351 sq km)
Major aquifers: Karoo Basin, Lower Kalahari-Stampriet Basin
Population distribution: the population concentrated along the southern and southeastern coast, and inland around Pretoria; the eastern half of the country is more densely populated than the west as shown in this population distribution map
Natural hazards: prolonged droughts
volcanism: the volcano forming Marion Island in the Prince Edward Islands, which last erupted in 2004, is South Africa’s only active volcano
Geography - note: South Africa completely surrounds Lesotho and almost completely surrounds Eswatini
PEOPLE AND SOCIETY
Population: 58,048,332 (2023 est.)
comparison ranking: 25
Nationality: noun: South African(s)
adjective: South African
Ethnic groups: Black African 81.4%, Colored 8.2%, White 7.3%, Indian/Asian 2.7%, other 0.4% (2022 est.)
note: colored is a term used in South Africa, including on the national census, for persons of mixed race ancestry who developed a distinct cultural identity over several hundred years
Languages: isiZulu (official) 25.3%, isiXhosa (official) 14.8%, Afrikaans (official) 12.2%, Sepedi (official) 10.1%, Setswana (official) 9.1%, English (official) 8.1%, Sesotho (official) 7.9%, Xitsonga (official) 3.6%, siSwati (official) 2.8%, Tshivenda (official) 2.5%, isiNdebele (official) 1.6%, other (includes Khoi, Nama, and San languages) 2%; note - data represent language spoken most often at home (2018 est.)
major-language sample(s):
Die Wereld Feite Boek, n’ onontbeerlike bron vir basiese informasie. (Afrikaans)
Religions: Christian 85.3%, African traditional 7.8%, Muslim 1.6%, Hindu 1.1%, other 1.3%, none 2.9% (2022 est.)
Demographic profile: South Africa’s youthful population is gradually aging, as the country’s total fertility rate (TFR) has declined dramatically from about 6 children per woman in the 1960s to roughly 2.2 in 2014, and has remained at this level as of 2022. This pattern is similar to fertility trends in South Asia, the Middle East, and North Africa, and sets South Africa apart from the rest of Sub-Saharan Africa, where the average TFR remains higher than other regions of the world. Today, South Africa’s decreasing number of reproductive age women is having fewer children, as women increase their educational attainment, workforce participation, and use of family planning methods; delay marriage; and opt for smaller families.
As the proportion of working-age South Africans has grown relative to children and the elderly, South Africa has been unable to achieve a demographic dividend because persistent high unemployment and the prevalence of HIV/AIDs have created a larger-than-normal dependent population. HIV/AIDS was also responsible for South Africa’s average life expectancy plunging to less than 43 years in 2008; it has rebounded to 65 years as of 2022. HIV/AIDS continues to be a serious public health threat, although awareness-raising campaigns and the wider availability of anti-retroviral drugs is stabilizing the number of new cases, enabling infected individuals to live longer, healthier lives, and reducing mother-child transmissions.
Migration to South Africa began in the second half of the 17th century when traders from the Dutch East India Company settled in the Cape and started using slaves from South and southeast Asia (mainly from India but also from present-day Indonesia, Bangladesh, Sri Lanka, and Malaysia) and southeast Africa (Madagascar and Mozambique) as farm laborers and, to a lesser extent, as domestic servants. The Indian subcontinent remained the Cape Colony’s main source of slaves in the early 18th century, while slaves were increasingly obtained from southeast Africa in the latter part of the 18th century and into the 19th century under British rule.
After slavery was completely abolished in the British Empire in 1838, South Africa’s colonists turned to temporary African migrants and indentured labor through agreements with India and later China, countries that were anxious to export workers to alleviate domestic poverty and overpopulation. Of the more than 150,000 indentured Indian laborers hired to work in Natal’s sugar plantations between 1860 and 1911, most exercised the right as British subjects to remain permanently (a small number of Indian immigrants came freely as merchants). Because of growing resentment toward Indian workers, the 63,000 indentured Chinese workers who mined gold in Transvaal between 1904 and 1911 were under more restrictive contracts and generally were forced to return to their homeland.
In the late 19th century and nearly the entire 20th century, South Africa’s then British colonies’ and Dutch states’ enforced selective immigration policies that welcomed “assimilable” white Europeans as permanent residents but excluded or restricted other immigrants. Following the Union of South Africa’s passage of a law in 1913 prohibiting Asian and other non-white immigrants and its elimination of the indenture system in 1917, temporary African contract laborers from neighboring countries became the dominant source of labor in the burgeoning mining industries. Others worked in agriculture and smaller numbers in manufacturing, domestic service, transportation, and construction. Throughout the 20th century, at least 40% of South Africa’s miners were foreigners; the numbers peaked at over 80% in the late 1960s. Mozambique, Lesotho, Botswana, and Eswatini were the primary sources of miners, and Malawi and Zimbabwe were periodic suppliers.
Under apartheid, a “two gates” migration policy focused on policing and deporting illegal migrants rather than on managing migration to meet South Africa’s development needs. The exclusionary 1991 Aliens Control Act limited labor recruitment to the highly skilled as defined by the ruling white minority, while bilateral labor agreements provided exemptions that enabled the influential mining industry and, to a lesser extent, commercial farms, to hire temporary, low-paid workers from neighboring states. Illegal African migrants were often tacitly allowed to work for low pay in other sectors but were always under threat of deportation.
The abolishment of apartheid in 1994 led to the development of a new inclusive national identity and the strengthening of the country’s restrictive immigration policy. Despite South Africa’s protectionist approach to immigration, the downsizing and closing of mines, and rising unemployment, migrants from across the continent believed that the country held work opportunities. Fewer African labor migrants were issued temporary work permits and, instead, increasingly entered South Africa with visitors’ permits or came illegally, which drove growth in cross-border trade and the informal job market. A new wave of Asian immigrants has also arrived over the last two decades, many operating small retail businesses.
In the post-apartheid period, increasing numbers of highly skilled white workers emigrated, citing dissatisfaction with the political situation, crime, poor services, and a reduced quality of life. The 2002 Immigration Act and later amendments were intended to facilitate the temporary migration of skilled foreign labor to fill labor shortages, but instead the legislation continues to create regulatory obstacles. Although the education system has improved and brain drain has slowed in the wake of the 2008 global financial crisis, South Africa continues to face skills shortages in several key sectors, such as health care and technology.
South Africa’s stability and economic growth has acted as a magnet for refugees and asylum seekers from nearby countries, despite the prevalence of discrimination and xenophobic violence. Refugees have included an estimated 350,000 Mozambicans during its 1980s civil war and, more recently, several thousand Somalis, Congolese, and Ethiopians. Nearly all of the tens of thousands of Zimbabweans who have applied for asylum in South Africa have been categorized as economic migrants and denied refuge.
Age structure: 0-14 years: 27.29% (male 7,931,943/female 7,906,715)
15-64 years: 66.17% (male 19,158,920/female 19,253,679)
65 years and over: 6.54% (2023 est.) (male 1,596,882/female 2,200,193)
Dependency ratios: total dependency ratio: 52.2
youth dependency ratio: 43.9
elderly dependency ratio: 8.4
potential support ratio: 10.9 (2021 est.)
Median age: total: 30.1 years (2023 est.)
male: 29.9 years
female: 30.3 years
comparison ranking: total 135
Population growth rate: 1.08% (2023 est.)
comparison ranking: 89
Birth rate: 18.3 births/1,000 population (2023 est.)
comparison ranking: 78
Death rate: 7.2 deaths/1,000 population (2023 est.)
comparison ranking: 117
Net migration rate: -0.3 migrant(s)/1,000 population (2023 est.)
comparison ranking: 114
Population distribution: the population concentrated along the southern and southeastern coast, and inland around Pretoria; the eastern half of the country is more densely populated than the west as shown in this population distribution map
Urbanization: urban population: 68.8% of total population (2023)
rate of urbanization: 1.72% annual rate of change (2020-25 est.)
Major urban areas - population: 10.316 million Johannesburg (includes Ekurhuleni), 4.890 million Cape Town (legislative capital), 3.228 million Durban, 2.818 million PRETORIA (administrative capital), 1.296 million Port Elizabeth, 934,000 West Rand (2023)
Sex ratio: at birth: 1.02 male(s)/female
0-14 years: 1 male(s)/female
15-64 years: 1 male(s)/female
65 years and over: 0.73 male(s)/female
total population: 0.96 male(s)/female (2023 est.)
Maternal mortality ratio: 127 deaths/100,000 live births (2020 est.)
comparison ranking: 59
Infant mortality rate: total: 24.4 deaths/1,000 live births (2023 est.)
male: 26.3 deaths/1,000 live births
female: 22.4 deaths/1,000 live births
comparison ranking: total 66
Life expectancy at birth: total population: 71 years (2023 est.)
male: 69.4 years
female: 72.6 years
comparison ranking: total population 168
Total fertility rate: 2.31 children born/woman (2023 est.)
comparison ranking: 78
Gross reproduction rate: 1.14 (2023 est.)
Contraceptive prevalence rate: 54.6% (2016)
Drinking water source: improved: urban: 99.7% of population
rural: 90.3% of population
total: 96.7% of population
unimproved: urban: 0.3% of population
rural: 9.7% of population
total: 3.3% of population (2020 est.)
Current health expenditure: 8.6% of GDP (2020)
Physicians density: 0.79 physicians/1,000 population (2019)
Sanitation facility access: improved: urban: 96.6% of population
rural: 86.4% of population
total: 93.2% of population
unimproved: urban: 3.4% of population
rural: 13.6% of population
total: 6.8% of population (2020 est.)
Major infectious diseases: degree of risk: intermediate (2023)
food or waterborne diseases: bacterial diarrhea, hepatitis A, and typhoid fever
water contact diseases: schistosomiasis
Obesity - adult prevalence rate: 28.3% (2016)
comparison ranking: 30
Alcohol consumption per capita: total: 7.21 liters of pure alcohol (2019 est.)
beer: 3.99 liters of pure alcohol (2019 est.)
wine: 1.21 liters of pure alcohol (2019 est.)
spirits: 1.31 liters of pure alcohol (2019 est.)
other alcohols: 0.7 liters of pure alcohol (2019 est.)
comparison ranking: total 58
Tobacco use: total: 20.3% (2020 est.)
male: 34% (2020 est.)
female: 6.5% (2020 est.)
comparison ranking: total 84
Children under the age of 5 years underweight: 5.5% (2017)
comparison ranking: 71
Currently married women (ages 15-49): 36.9% (2023 est.)
Child marriage: women married by age 15: 0.9%
women married by age 18: 3.6%
men married by age 18: 0.6% (2016 est.)
Education expenditures: 6.6% of GDP (2021 est.)
comparison ranking: 27
Literacy: definition: age 15 and over can read and write
total population: 95%
male: 95.5%
female: 94.5% (2019)
School life expectancy (primary to tertiary education): total: 13 years
male: 13 years
female: 14 years (2020)
Youth unemployment rate (ages 15-24): total: 64.2% (2021 est.)
male: 59.8%
female: 69.3%
comparison ranking: total 2
ENVIRONMENT
Environment - current issues: lack of important arterial rivers or lakes requires extensive water conservation and control measures; growth in water usage outpacing supply; pollution of rivers from agricultural runoff and urban discharge; air pollution resulting in acid rain; deforestation; soil erosion; land degradation; desertification; solid waste pollution; disruption of fragile ecosystem has resulted in significant floral extinctions
Environment - international agreements: party to: Antarctic-Environmental Protection, Antarctic-Marine Living Resources, Antarctic Seals, Antarctic Treaty, Biodiversity, Climate Change, Climate Change-Kyoto Protocol, Climate Change-Paris Agreement, Comprehensive Nuclear Test Ban, Desertification, Endangered Species, Hazardous Wastes, Law of the Sea, Marine Dumping-London Convention, Marine Dumping-London Protocol, Marine Life Conservation, Nuclear Test Ban, Ozone Layer Protection, Ship Pollution, Wetlands, Whaling
signed, but not ratified: none of the selected agreements
Climate: mostly semiarid; subtropical along east coast; sunny days, cool nights
Land use: agricultural land: 79.4% (2018 est.)
arable land: 9.9% (2018 est.)
permanent crops: 0.3% (2018 est.)
permanent pasture: 69.2% (2018 est.)
forest: 7.6% (2018 est.)
other: 13% (2018 est.)
Urbanization: urban population: 68.8% of total population (2023)
rate of urbanization: 1.72% annual rate of change (2020-25 est.)
Revenue from coal: 2.4% of GDP (2018 est.)
comparison ranking: 3
Air pollutants: particulate matter emissions: 19.75 micrograms per cubic meter (2019 est.)
carbon dioxide emissions: 476.64 megatons (2016 est.)
methane emissions: 55.89 megatons (2020 est.)
Waste and recycling: municipal solid waste generated annually: 18,457,232 tons (2011 est.)
municipal solid waste recycled annually: 5,168,025 tons (2011 est.)
percent of municipal solid waste recycled: 28% (2011 est.)
Major rivers (by length in km): Orange (shared with Lesotho [s], and Namibia [m]) - 2,092 km; Limpoporivier (Limpopo) river source (shared with Botswana, Zimbabwe, and Mozambique [m]) - 1,800 km; Vaal [s] - 1,210 km
note – [s] after country name indicates river source; [m] after country name indicates river mouth
Major watersheds (area sq km): Atlantic Ocean drainage: Orange (941,351 sq km)
Major aquifers: Karoo Basin, Lower Kalahari-Stampriet Basin
Total water withdrawal: municipal: 3.11 billion cubic meters (2020 est.)
industrial: 4.09 billion cubic meters (2020 est.)
agricultural: 11.99 billion cubic meters (2020 est.)
Total renewable water resources: 51.35 billion cubic meters (2020 est.)
GOVERNMENT
Country name: conventional long form: Republic of South Africa
conventional short form: South Africa
former: Union of South Africa
abbreviation: RSA
etymology: self-descriptive name from the country’s location on the continent; “Africa” is derived from the Roman designation of the area corresponding to present-day Tunisia “Africa terra,” which meant “Land of the Afri” (the tribe resident in that area), but which eventually came to mean the entire continent
Government type: parliamentary republic
Capital: name: Pretoria (administrative capital); Cape Town (legislative capital); Bloemfontein (judicial capital)
geographic coordinates: 25 42 S, 28 13 E
time difference: UTC+2 (7 hours ahead of Washington, DC, during Standard Time)
etymology: Pretoria is named in honor of Andries PRETORIUS, the father of voortrekker (pioneer) leader Marthinus PRETORIUS; Cape Town reflects its location on the Cape of Good Hope; Bloemfontein is a combination of the Dutch words bloem (flower) and fontein (fountain) meaning “fountain of flowers”
Administrative divisions: 9 provinces; Eastern Cape, Free State, Gauteng, KwaZulu-Natal, Limpopo, Mpumalanga, Northern Cape, North West, Western Cape
Independence: 31 May 1910 (Union of South Africa formed from four British colonies: Cape Colony, Natal, Transvaal, and Orange Free State); 22 August 1934 (Status of the Union Act); 31 May 1961 (republic declared); 27 April 1994 (majority rule)
National holiday: Freedom Day, 27 April (1994)
Constitution: history: several previous; latest drafted 8 May 1996, approved by the Constitutional Court 4 December 1996, effective 4 February 1997
amendments: proposed by the National Assembly of Parliament; passage of amendments affecting constitutional sections on human rights and freedoms, non-racism and non-sexism, supremacy of the constitution, suffrage, the multiparty system of democratic government, and amendment procedures requires at least 75% majority vote of the Assembly, approval by at least six of the nine provinces represented in the National Council of Provinces, and assent of the president of the republic; passage of amendments affecting the Bill of Rights, and those related to provincial boundaries, powers, and authorities requires at least two-thirds majority vote of the Assembly, approval by at least six of the nine provinces represented in the National Council, and assent of the president; amended many times, last in 2020
Legal system: mixed legal system of Roman-Dutch civil law, English common law, and customary law
International law organization participation: has not submitted an ICJ jurisdiction declaration; accepts ICCt jurisdiction
Citizenship: citizenship by birth: no
citizenship by descent only: at least one parent must be a citizen of South Africa
dual citizenship recognized: yes, but requires prior permission of the government
residency requirement for naturalization: 5 year
Suffrage: 18 years of age; universal
Executive branch: chief of state: President Matamela Cyril RAMAPHOSA (since 15 February 2018); Deputy President Paul MASHSATILE (since 7 March 2023); note - the president is both chief of state and head of government; note - Deputy President David MABUZA resigned 1 March 2023
head of government: President Matamela Cyril RAMAPHOSA (since 15 February 2018); Deputy President Paul MASHSATILE (since 7 March 2023)
cabinet: Cabinet appointed by the president
elections/appointments: president indirectly elected by the National Assembly for a 5-year term (eligible for a second term); election last held on 22 May 2019 (next to be held in May 2024)
election results:
2019: Matamela Cyril RAMAPHOSA (ANC) elected president by the National Assembly unopposed
2014: Jacob ZUMA (ANC) reelected president by the National Assembly unopposed
Legislative branch: description: bicameral Parliament consists of:
National Council of Provinces (90 seats; nine 10-member delegations, each with 6 permanent delegates and 4 special delegates, appointed by each of the 9 provincial legislatures to serve 5-year terms; note - the Council has special powers to protect regional interests, including safeguarding cultural and linguistic traditions among ethnic minorities)
National Assembly (400 seats; half the members directly elected in multi-seat constituencies and half in a single nationwide constituency, both by proportional representation popular vote; members serve 5-year terms)
elections: National Council of Provinces and National Assembly - last held on 8 May 2019 (next to be held in 2024)
election results:
National Council of Provinces - percent of vote by party - NA; seats by party - ANC 29, DA 13, EFF 9, FF+ 2, IFP 1; composition of permanent members - men 34, women 20, percent of women 37%; note - 36 appointed members not filled
National Assembly - percent of vote by party - ANC 57.5%, DA 20.8%, EFF 10.8%, IFP 3.8%, FF+ 2.4%, other 4.7%; seats by party - ANC 230, DA 84, EFF 44, IFP 14, FF+ 10, other 18; composition as of mid-2022 (396 current seats) - men 212, women 184, percent of women 46.5%; note overall Parliament percent of women 45.3%
Judicial branch: highest court(s): Supreme Court of Appeals (consists of the court president, deputy president, and 21 judges); Constitutional Court (consists of the chief and deputy chief justices and 9 judges)
judge selection and term of office: Supreme Court of Appeals president and vice president appointed by the national president after consultation with the Judicial Services Commission (JSC), a 23-member body chaired by the chief justice and includes other judges and judicial executives, members of parliament, practicing lawyers and advocates, a teacher of law, and several members designated by the president of South Africa; other Supreme Court judges appointed by the national president on the advice of the JSC and hold office until discharged from active service by an Act of Parliament; Constitutional Court chief and deputy chief justices appointed by the president of South Africa after consultation with the JSC and with heads of the National Assembly; other Constitutional Court judges appointed by the national president after consultation with the chief justice and leaders of the National Assembly; Constitutional Court judges serve 12-year nonrenewable terms or until age 70
subordinate courts: High Courts; Magistrates’ Courts; labor courts; land claims courts
Political parties and leaders: African Christian Democratic Party or ACDP [Kenneth MESHOE]
African Independent Congress or AIC [Mandla GALO]
African National Congress or ANC [Cyril RAMAPHOSA]
African People’s Convention or APC [Themba GODI]
Agang SA [Andries TLOUAMMA]
Congress of the People or COPE [Mosiuoa LEKOTA]
Democratic Alliance or DA [John STEENHUISEN]
Economic Freedom Fighters or EFF [Julius Sello MALEMA]
Freedom Front Plus or FF+ [Pieter GROENEWALD]
GOOD [Patricia de LILLE]
Inkatha Freedom Party or IFP [Velenkosini HLABISA]
National Freedom Party or NFP (vacant)
Pan-Africanist Congress of Azania or PAC [Mzwanele NYHONTSO]
United Christian Democratic Party or UCDP [Modiri Desmond SEHUME]
United Democratic Movement or UDM [Bantu HOLOMISA]
International organization participation: ACP, AfDB, AU, BIS, BRICS, C, CD, FAO, FATF, G-20, G-24, G-5, G-77, IAEA, IBRD, ICAO, ICC (national committees), ICCt, ICRM, IDA, IFAD, IFC, IFRCS, IHO, ILO, IMF, IMO, IMSO, Interpol, IOC, IOM, IPU, ISO, ITSO, ITU, ITUC (NGOs), MIGA, MONUSCO, NAM, NSG, OECD (enhanced engagement), OPCW, Paris Club (associate), PCA, SACU, SADC, UN, UNAMID, UNCTAD, UNESCO, UNHCR, UNIDO, UNISFA, UNITAR, UNWTO, UPU, Wassenaar Arrangement, WCO, WFTU (NGOs), WHO, WIPO, WMO, WTO, ZC
Diplomatic representation in the US: chief of mission: Ambassador (vacant); Chargé d’Affaires Ismail ESAU (since 14 August 2023)
chancery: 3051 Massachusetts Avenue NW, Washington, DC 20008
telephone: [1] (202) 413-1953
FAX: [1] (202) 265-1607
email address and website:
consulate(s) general: Chicago, Los Angeles, New York
Diplomatic representation from the US: chief of mission: Ambassador Reuben E. BRIGETY II (since 11 August 2022)
embassy: 877 Pretorius Street, Arcadia, Pretoria
mailing address: 9300 Pretoria Place, Washington DC 20521-9300
telephone: [27] (12) 431-4000
FAX: [27] (12) 342-2299
email address and website:
consulate(s) general: Cape Town, Durban, Johannesburg
Flag description: two equal width horizontal bands of red (top) and blue separated by a central green band that splits into a horizontal Y, the arms of which end at the corners of the hoist side; the Y embraces a black isosceles triangle from which the arms are separated by narrow yellow bands; the red and blue bands are separated from the green band and its arms by narrow white stripes; the flag colors do not have any official symbolism, but the Y stands for the “convergence of diverse elements within South African society, taking the road ahead in unity”; black, yellow, and green are found on the flag of the African National Congress, while red, white, and blue are the colors in the flags of the Netherlands and the UK, whose settlers ruled South Africa during the colonial era
note: the South African flag is one of only two national flags to display six colors as part of its primary design, the other is South Sudan’s
National symbol(s): springbok (antelope), king protea flower; national colors: red, green, blue, yellow, black, white
National anthem: name: “National Anthem of South Africa”
lyrics/music: Enoch SONTONGA and Cornelius Jacob LANGENHOVEN/Enoch SONTONGA and Marthinus LOURENS de Villiers
note: adopted 1994; a combination of “N’kosi Sikelel’ iAfrica” (God Bless Africa) and “Die Stem van Suid Afrika” (The Call of South Africa), which were respectively the anthems of the non-white and white communities under apartheid; official lyrics contain a mixture of Xhosa, Zulu, Sesotho, Afrikaans, and English (i.e., the five most widely spoken of South Africa’s 11 official languages); music incorporates the melody used in the Tanzanian and Zambian anthems
National heritage: total World Heritage Sites: 10 (5 cultural, 4 natural, 1 mixed)
selected World Heritage Site locales: Fossil Hominid Sites of South Africa (c); iSimangaliso Wetland Park (n); Robben Island (c); Maloti-Drakensberg Park (m); Mapungubwe Cultural Landscape (c); Cape Floral Region Protected Areas (n); Vredefort Dome (n); Richtersveld Cultural and Botanical Landscape (c); Khomani Cultural Landscape (c); Barberton Makhonjwa Mountains (n)
ECONOMY
Economic overview: upper middle-income South African economy; hard hit by COVID-19; poor utilities management; key rare earth goods exporter; high income inequality; hosts Africa’s largest stock exchange; rising unemployment, especially youth; land rights changes
Real GDP (purchasing power parity): $790.625 billion (2021 est.)
$753.6 billion (2020 est.)
$804.634 billion (2019 est.)
note: data are in 2017 dollars
comparison ranking: 32
Real GDP growth rate: 4.91% (2021 est.)
-6.34% (2020 est.)
0.3% (2019 est.)
comparison ranking: 92
Real GDP per capita: $13,300 (2021 est.)
$12,800 (2020 est.)
$13,900 (2019 est.)
note: data are in 2017 dollars
comparison ranking: 124
GDP (official exchange rate): $350.032 billion (2019 est.)
Inflation rate (consumer prices): 4.61% (2021 est.)
3.21% (2020 est.)
4.12% (2019 est.)
comparison ranking: 75
Credit ratings: Fitch rating: BB- (2020)
Moody’s rating: Ba2 (2020)
Standard & Poors rating: BB- (2020)
note: The year refers to the year in which the current credit rating was first obtained.
GDP - composition, by sector of origin: agriculture: 2.8% (2017 est.)
industry: 29.7% (2017 est.)
services: 67.5% (2017 est.)
comparison rankings: services 84; industry 78; agriculture 155
GDP - composition, by end use: household consumption: 59.4% (2017 est.)
government consumption: 20.9% (2017 est.)
investment in fixed capital: 18.7% (2017 est.)
investment in inventories: -0.1% (2017 est.)
exports of goods and services: 29.8% (2017 est.)
imports of goods and services: -28.4% (2017 est.)
Agricultural products: sugar cane, maize, milk, potatoes, grapes, poultry, oranges, wheat, soybeans, beef
Industries: mining (world’s largest producer of platinum, gold, chromium), automobile assembly, metalworking, machinery, textiles, iron and steel, chemicals, fertilizer, foodstuffs, commercial ship repair
Industrial production growth rate: 6.12% (2021 est.)
comparison ranking: 72
Labor force: 22.398 million (2021 est.)
comparison ranking: 29
Labor force - by occupation: agriculture: 4.6%
industry: 23.5%
services: 71.9% (2014 est.)
Unemployment rate: 33.56% (2021 est.)
29.22% (2020 est.)
28.47% (2019 est.)
comparison ranking: 2
Youth unemployment rate (ages 15-24): total: 64.2% (2021 est.)
male: 59.8%
female: 69.3%
comparison ranking: total 2
Population below poverty line: 55.5% (2014 est.)
Gini Index coefficient - distribution of family income: 63 (2014 est.)
comparison ranking: 1
Average household expenditures: on food: 21.4% of household expenditures (2018 est.)
on alcohol and tobacco: 4.9% of household expenditures (2018 est.)
Household income or consumption by percentage share: lowest 10%: 1.2%
highest 10%: 51.3% (2011 est.)
Budget: revenues: $84.19 billion (2020 est.)
expenditures: $121.204 billion (2020 est.)
Budget surplus (+) or deficit (-): -4.4% (of GDP) (2017 est.)
comparison ranking: 162
Public debt: 53% of GDP (2017 est.)
51.6% of GDP (2016 est.)
comparison ranking: 97
Taxes and other revenues: 23.3% (of GDP) (2020 est.)
comparison ranking: 62
Fiscal year: 1 April - 31 March
Current account balance: $15.569 billion (2021 est.)
$6.788 billion (2020 est.)
-$10.037 billion (2019 est.)
comparison ranking: 23
Exports: $130.885 billion (2021 est.) note: data are in current year dollars
$94.123 billion (2020 est.) note: data are in current year dollars
$105.988 billion (2019 est.) note: data are in current year dollars
comparison ranking: 39
Exports - partners: China 15%, United Kingdom 8%, Germany 7%, United States 6%, India 6% (2019)
Exports - commodities: gold, platinum, cars, iron products, coal, manganese, diamonds (2019)
Imports: $104.806 billion (2021 est.) note: data are in current year dollars
$79.022 billion (2020 est.) note: data are in current year dollars
$103.92 billion (2019 est.) note: data are in current year dollars
comparison ranking: 44
Imports - partners: China 18%, Germany 11%, United States 6%, India 5% (2019)
Imports - commodities: crude petroleum, refined petroleum, cars and vehicle parts, gold, broadcasting equipment (2019)
Reserves of foreign exchange and gold: $57.597 billion (31 December 2021 est.)
$55.008 billion (31 December 2020 est.)
$55.056 billion (31 December 2019 est.)
comparison ranking: 41
Debt - external: $179.871 billion (2019 est.)
$173.714 billion (2018 est.)
comparison ranking: 43
Exchange rates: rand (ZAR) per US dollar -
Exchange rates:
14.779 (2021 est.)
16.459 (2020 est.)
14.448 (2019 est.)
13.234 (2018 est.)
13.324 (2017 est.)
ENERGY
Electricity access: population without electricity: 3 million (2020)
electrification - total population: 89.3% (2021)
electrification - urban areas: 87.3% (2021)
electrification - rural areas: 93.3% (2019)
Electricity: installed generating capacity: 62.728 million kW (2020 est.)
consumption: 202,285,870,000 kWh (2019 est.)
exports: 14.482 billion kWh (2019 est.)
imports: 7.823 billion kWh (2019 est.)
transmission/distribution losses: 22.904 billion kWh (2019 est.)
comparison rankings: installed generating capacity 21; transmission/distribution losses 20; imports 29; exports 14; consumption 21
Electricity generation sources: fossil fuels: 87.9% of total installed capacity (2020 est.)
nuclear: 5.2% of total installed capacity (2020 est.)
solar: 1.6% of total installed capacity (2020 est.)
wind: 2.6% of total installed capacity (2020 est.)
hydroelectricity: 2.5% of total installed capacity (2020 est.)
biomass and waste: 0.2% of total installed capacity (2020 est.)
Nuclear energy: Number of operational nuclear reactors: 2 (2023)
Number of nuclear reactors under construction: 0
Net capacity of operational nuclear reactors: 1.85GW (2023)
Percent of total electricity production: 6% (2021)
Percent of total energy produced: 2.3% (2021)
Number of nuclear reactors permanently shut down: 0
Coal: production: 248.388 million metric tons (2020 est.)
consumption: 170.308 million metric tons (2020 est.)
exports: 74.965 million metric tons (2020 est.)
imports: 2.054 million metric tons (2020 est.)
proven reserves: 9.893 billion metric tons (2019 est.)
Petroleum: total petroleum production: 97,900 bbl/day (2021 est.)
refined petroleum consumption: 622,500 bbl/day (2019 est.)
crude oil and lease condensate exports: 9,000 bbl/day (2018 est.)
crude oil and lease condensate imports: 397,700 bbl/day (2018 est.)
crude oil estimated reserves: 15 million barrels (2021 est.)
Refined petroleum products - production: 487,100 bbl/day (2015 est.)
comparison ranking: 33
Refined petroleum products - exports: 105,600 bbl/day (2015 est.)
comparison ranking: 42
Refined petroleum products - imports: 195,200 bbl/day (2015 est.)
comparison ranking: 34
Natural gas: production: 1,229,544,000 cubic meters (2019 est.)
consumption: 4,771,551,000 cubic meters (2019 est.)
exports: 0 cubic meters (2021 est.)
imports: 3,542,007,000 cubic meters (2019 est.)
proven reserves: 0 cubic meters (2021 est.)
Carbon dioxide emissions: 470.358 million metric tonnes of CO2 (2019 est.)
from coal and metallurgical coke: 387.835 million metric tonnes of CO2 (2019 est.)
from petroleum and other liquids: 73.163 million metric tonnes of CO2 (2019 est.)
from consumed natural gas: 9.361 million metric tonnes of CO2 (2019 est.)
comparison ranking: total emissions 12
Energy consumption per capita: 98.474 million Btu/person (2019 est.)
comparison ranking: 61
COMMUNICATIONS
Telephones - fixed lines: total subscriptions: 1,472,191 (2021 est.)
subscriptions per 100 inhabitants: 2 (2021 est.)
comparison ranking: total subscriptions 62
Telephones - mobile cellular: total subscriptions: 100,328,005 (2021 est.)
subscriptions per 100 inhabitants: 169 (2021 est.)
comparison ranking: total subscriptions 18
Telecommunication systems: general assessment: South Africa’s telecom sector boasts one of the most advanced infrastructures on the continent; the focus in recent years has been on back haul capacity and on fiber and LTE networks to extend and improve internet service connectivity; with the ongoing migration to fiber, the incumbent telco expects to close down its copper network in 2024; the mobile sector has developed strongly in recent years, partly due to the poor availability and level of service of fixed-line networks, which meant that many people had no alternative to mobile networks for voice and data services; the multi-spectrum auction was delayed several times due to legal wrangling, and was finally held in March 2022; the delay caused difficulties for network operators, which were forced to reform spectrum for 3G and LTE use, and provide 5G services on temporary licenses; six qualified bidders acquired spectrum, netting the regulator ZAR14.4 billion in revenues; the market is shrugging off the impact of the pandemic, which had a significant impact on production and supply chains globally, and saw a slowdown in some network expansions, particularly around 5G; on the consumer side, spending on telecoms services and devices remains slightly under pressure amid ongoing macroeconomic challenges facing the country; the crucial nature of telecom services, both for general communication as well as a tool for homeworking, will offset such pressures; in many markets the net effect should be a steady though reduced increase in subscriber growth (2022)
domestic: fixed-line is 2 per 100 persons and mobile-cellular is 169 telephones per 100 persons (2021)
international: country code - 27; landing points for the WACS, ACE, SAFE, SAT-3, Equiano, SABR, SAEx1, SAEx2, IOX Cable System, METISS, EASSy, and SEACOM/ Tata TGN-Eurasia fiber-optic submarine cable systems connecting South Africa, East Africa, West Africa, Europe, Southeast Asia, Asia, South America, Indian Ocean Islands, and the US; satellite earth stations - 3 Intelsat (1 Indian Ocean and 2 Atlantic Ocean) (2019)
Broadcast media: the South African Broadcasting Corporation (SABC) operates 4 TV stations, 3 are free-to-air and 1 is pay TV; e.tv, a private station, is accessible to more than half the population; multiple subscription TV services provide a mix of local and international channels; well-developed mix of public and private radio stations at the national, regional, and local levels; the SABC radio network, state-owned and controlled but nominally independent, operates 18 stations, one for each of the 11 official languages, 4 community stations, and 3 commercial stations; more than 100 community-based stations extend coverage to rural areas
Internet country code: .za
Internet users: total: 42.48 million (2021 est.)
percent of population: 72% (2021 est.)
comparison ranking: total 24
Broadband - fixed subscriptions: total: 1,303,057 (2020 est.)
subscriptions per 100 inhabitants: 2 (2020 est.)
comparison ranking: total 68
TRANSPORTATION
National air transport system: number of registered air carriers: 17 (2020)
inventory of registered aircraft operated by air carriers: 243
annual passenger traffic on registered air carriers: 23,921,748 (2018)
annual freight traffic on registered air carriers: 716.25 million (2018) mt-km
Civil aircraft registration country code prefix: ZS
Airports: 407 (2021)
comparison ranking: total 20
Airports - with paved runways: 130
civil airports: 21
military airports: 7
joint use (civil-military) airports: 1
other airports: 101
note: paved runways have a concrete or asphalt surface but not all have facilities for refueling, maintenance, or air traffic control; the length of a runway required for aircraft to safely operate depends on a number of factors including the type of aircraft, the takeoff weight (including passengers, cargo, and fuel), engine types, flap settings, landing speed, elevation of the airport, and average maximum daily air temperature; paved runways can reach a length of 5,000 m (16,000 ft.), but the “typical” length of a commercial airline runway is between 2,500-4,000 m (8,000-13,000 ft.)
Airports - with unpaved runways: 277
note: unpaved runways have a surface composition such as grass or packed earth and are most suited to the operation of light aircraft; unpaved runways are usually short, often less than 1,000 m (3,280 ft.) in length; airports with unpaved runways often lack facilities for refueling, maintenance, or air traffic control
Pipelines: 94 km condensate, 1,293 km gas, 992 km oil, 1,460 km refined products (2013)
Railways: total: 20,986 km (2014)
standard gauge: 80 km (2014) 1.435-m gauge (80 km electrified)
narrow gauge: 19,756 km (2014) 1.065-m gauge (8,271 km electrified)
other: (2014) 1,150 km (passenger rail, gauge unspecified, 1,115.5 km electrified)
comparison ranking: total 13
Roadways: total: 750,000 km (2016)
paved: 158,124 km (2016)
unpaved: 591,876 km (2016)
comparison ranking: total 11
Merchant marine: total: 107 (2022)
by type: bulk carrier 3, general cargo 1, oil tanker 7, other 96
comparison ranking: total 86
Ports and terminals: major seaport(s): Cape Town, Durban, Port Elizabeth, Richards Bay, Saldanha Bay
container port(s) (TEUs): Durban (2,430,295) (2021)
LNG terminal(s) (import): Mossel Bay
Transportation - note: South Africa operates one PC 5 or 6 class light icebreaker
note - PC indicates a Polar Class vessel: PC 5 - year-round operation in medium first-year ice which may include old ice inclusions (ice thickness up to 70-120 cm); PC 6 - summer/autumn operation in medium first-year ice which may include old ice inclusions (ice thickness up to 30-70 cm)
MILITARY AND SECURITY
Military and security forces: South African National Defense Force (SANDF): South African Army (includes Reserve Force), South African Navy (SAN), South African Air Force (SAAF), South African Military Health Services
Ministry of Police: South African Police Service (2023)
note: the South African Police Service includes a Special Task Force for counterterrorism, counterinsurgency, and hostage rescue operations
Military expenditures: 0.7% of GDP (2023 est.)
0.8% of GDP (2022 est.)
0.9% of GDP (2021 est.)
1.1% of GDP (2020 est.)
1% of GDP (2019 est.)
comparison ranking: 144
Military and security service personnel strengths: approximately 75,000 active-duty personnel (40,000 Army; 7,000 Navy; 10,000 Air Force; 8,000 Military Health Service; 10,000 other, including administrative, logistics, military police); 180,000 South African Police Service (2023)
Military equipment inventories and acquisitions: the SANDF’s inventory consists of a mix of domestically produced and foreign-supplied equipment; South Africa’s domestic defense industry produced most of the Army’s major weapons systems (some were jointly produced with foreign companies), while the Air Force and Navy inventories include a mix of aging European-, Israeli-, and US-origin weapons and equipment; the SANDF has received only a limited number of imported weapons in recent years (2023)
Military service age and obligation: 18-22 (18-26 for college graduates) years of age for voluntary military service for men and women; 2-year service obligation (2023)
note: in 2020, women comprised about 30% of the military
Military deployments: 1,150 Democratic Republic of the Congo (MONUSCO); up to 1,500 Mozambique (part of a Southern African Development Community force to help quell an insurgency) (2023)
Military - note: the SANDF’s primary responsibilities include territorial and maritime defense, supporting the Police Service, protecting key infrastructure, and participating in international peacekeeping missions; the SANDF traditionally has been one of Africa’s most capable militaries, but in recent years its operational readiness and modernization programs have been hampered by funding shortfalls; it participates regularly in African and UN peacekeeping missions and is a member of the Southern Africa Development Community (SADC) Standby Force; in 2021, it sent approximately 1,500 troops to Mozambique as part of a multinational SADC force to help combat an insurgency, and South African forces are a key component of the UN’s Force Intervention Brigade in the Democratic Republic of the Congo; in recent years, the SANDF has been deployed internally to assist the Police Service with quelling unrest and to combat trafficking along the border
the Army in recent years has reorganized, and its combat forces are organized into 4 “modern” brigades, each designed for specific missions and responding to modern-day threats such as “asymmetric” warfare; the new brigades are separated into airborne, light infantry, mechanized, and motorized forces; the Navy operates a mixed force of warships, patrol craft, submarines, and support vessels; its principal combatants are 4 frigates and 3 attack submarines; the Navy also has a maritime rapid reaction squadron that includes naval infantry and combat divers; the Air Force has squadrons of multipurpose fighter, ground attack, and transport aircraft, as well as attack and transport helicopters
the SANDF was created in 1994 to replace the South African Defense Force (SADF); the SANDF was opened to all South Africans who met military requirements, while the SADF was a mostly white force (only whites were subject to conscription) with non-whites only allowed to join in a voluntary capacity; the SANDF also absorbed members of the guerrilla and militia forces of the various anti-apartheid opposition groups, including the African National Congress, the Pan Africanist Congress, and the Inkatha Freedom Party, as well as the security forces of the formerly independent Bantustan homelands (2023)
SPACE
Space agency/agencies: South African National Space Agency (SANSA; established 2010); South Africa Council for Space Affairs (SACSA; statutory body established 1995); South African Radio Telescope Observatory (SARAO) (2023)
Space launch site(s): Arniston launch facility (Western Cape) used to support space launch vehicle and ballistic missile program (1980s-1990s) (2023)
Space program overview: the largest producer of satellites (particularly nanosatellites) in Africa; areas of focus for development include remote sensing (RS) capabilities, such as optical instruments and synthetic aperture radar systems, space engineering, ground support to space operations (tracking, telemetry, etc.), and space science, particularly astronomy; SANSA is responsible for aggregating RS data for southern African countries; has a sounding rocket program for carrying experimental payloads for research purposes; cooperates with foreign space agencies and industries, including those of China, France, India, Russia, and the US; participates in international programs such as the Square Kilometer Array (SKA) Project, an international effort to build the world’s largest radio telescope by 2030; has more than 120 state- and privately-owned aerospace companies, as well as a substantial number of academic and research institutions involved in space-related activities (2023)
note: further details about the key activities, programs, and milestones of the country’s space program, as well as government spending estimates on the space sector, appear in Appendix S
TERRORISM
Terrorist group(s): Terrorist group(s): Islamic State of Iraq and ash-Sham (ISIS)
note: details about the history, aims, leadership, organization, areas of operation, tactics, targets, weapons, size, and sources of support of the group(s) appear(s) in Appendix-T
TRANSNATIONAL ISSUES
Disputes - international: South Africa-Botswana: none identified
South Africa-Eswatini: Eswatini seeks to reclaim land it says was stolen by South Africa
South Africa-Lesotho: crossborder livestock thieving, smuggling of drugs and arms, and illegal migration are problematic
South Africa-Mozambique: animal poachers cross the South Africa-Mozambique border to hunt wildlife in South Africa’s Kruger National Park; border fences were removed in some areas to allow animals to roam between nature reserves in the two countries; improved patrols, technology, and crossborder cooperation are reducing the problem
South Africa-Namibia: the governments of South Africa and Namibia have not signed or ratified the text of the 1994 Surveyor’s General agreement placing the boundary in the middle of the Orange River; the location of the border could affect diamond mining rights; South Africa has always claimed that the northern bank of the Orange River is the border between the two countries, while Namibia’s constitution states that the border lies in the middle of the Orange River
South Africa-various: South Africa has placed military units to assist police operations along the border of Lesotho, Zimbabwe, and Mozambique to control smuggling, poaching, and illegal migration
South Africa-Zimbabwe: Zimbabweans migrate illegally into South Africa in search of work or smuggle goods to sell at a profit back home
Refugees and internally displaced persons: refugees (country of origin): 22,388 (Somalia), 15,240 (Ethiopia) (mid-year 2022); 42,080 (Democratic Republic of the Congo) (refugees and asylum seekers) (2023)
IDPs: 5,000 (2020)
Trafficking in persons: tier rating: Tier 2 Watch List — South Africa does not fully meet the minimum standards for the elimination of trafficking but is making significant efforts to do so; the government increased investigations and convictions of traffickers, investigated and prosecuted some allegedly complicit government officials, coordinated with foreign governments on trafficking investigations and the repatriation of victims, and increased inspections to investigate forced labor; officials adopted an anti-trafficking National Action Plan, accredited two shelters, and expanded awareness-raising activities; however, the government did not demonstrate overall increasing efforts, compared with the previous reporting period, to expand its anti-trafficking capacity; while the government approved regulations under the Prevention and Combating of Trafficking in Persons Act on immigration, the regulations had not been put into effect at the end of the reporting period; a lack of inter-agency coordination in identifying, referring, and certifying victims most likely hindered protection efforts; law enforcement personnel lacked the capacity and training to effectively identify and refer victims; victims were inappropriately penalized for offenses committed as a direct result of being trafficked, even after officials identified them as trafficking victims; reports of low-level official complicity persisted; because the government has devoted significant resources to a written plan that, if implemented, would constitute significant efforts to meet the minimum standards, South Africa was granted a waiver per the Trafficking Victims Protection Act from an otherwise required downgrade to Tier 3; therefore, South Africa remained on Tier 2 Watch List for the third consecutive year (2023)
trafficking profile: Human traffickers exploit domestic and foreign victims in South Africa, as well as South Africans abroad; traffickers recruit victims from neighboring countries and rural areas within South Africa and exploit them in sex trafficking locally and in urban centers; adults and children, particularly from poor and rural areas, and migrants are forced into labor in domestic service, mining, food services, construction, criminal activities, agriculture, and the fishing sector; high unemployment and socioeconomic stratification increased the vulnerability of exploitation, particularly of youth, Black women, and foreign migrants; traffickers recruit victims who are unemployed and struggle with drug use, and commonly use substance abuse to control victims, including children; parents with substance abuse problems sometimes exploit their children in sex trafficking to pay for drugs; despite high unemployment, migrants travel from East, Central, and Southern Africa to South Africa looking for economic opportunity, particularly from Ethiopia and Mozambique, and are vulnerable to exploitation; official complicity in trafficking crimes, especially by police and immigration officials, facilitated trafficking; syndicates, often dominated by Nigerians, force women from Nigeria and countries bordering South Africa into commercial sex; South African trafficking rings exploit girls as young as 10 years old in sex trafficking; some brothels, previously identified as locations for sex trafficking, continue to operate with officials’ tacit approval; syndicates also recruit South African women to go to Europe, where some are forced into commercial sex, domestic service, or drug smuggling; Chinese business owners exploit Chinese, South African, and Malawian adults and children in factories, sweatshops, and other businesses; the Cuban government may have forced Cuban medical workers to work in South Africa (2023)
Illicit drugs: leading regional importer of chemicals used in the production of illicit drugs especially synthetic drugs;