UNITED STATES
INTRODUCTION
Background: Britain’s American colonies broke with the mother country in 1776 and were recognized as the new nation of the United States of America following the Treaty of Paris in 1783. During the 19th and 20th centuries, 37 new states were added to the original 13 as the nation expanded across the North American continent and acquired a number of overseas possessions. The two most traumatic experiences in the nation’s history were the Civil War (1861-65), in which a northern Union of states defeated a secessionist Confederacy of 11 southern slave states, and the Great Depression of the 1930s, an economic downturn during which about a quarter of the labor force lost its jobs. Buoyed by victories in World Wars I and II and the end of the Cold War in 1991, the US remains the world’s most powerful nation state. Since the end of World War II, the economy has achieved relatively steady growth, low unemployment and inflation, and rapid advances in technology.
GEOGRAPHY
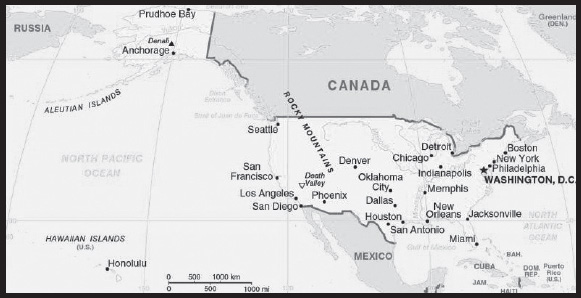
Location: North America, bordering both the North Atlantic Ocean and the North Pacific Ocean, between Canada and Mexico
Geographic coordinates: 38 00 N, 97 00 W
Map references: North America
Area: total: 9,833,517 sq km
land: 9,147,593 sq km
water: 685,924 sq km
note: includes only the 50 states and District of Columbia, no overseas territories
comparison ranking: total 4
Area - comparative: about half the size of Russia; about three-tenths the size of Africa; about half the size of South America (or slightly larger than Brazil); slightly larger than China; more than twice the size of the European Union
Land boundaries: total: 12,002 km
border countries (2): Canada 8,891 km (including 2,475 km with Alaska); Mexico 3,111 km
note: US Naval Base at Guantanamo Bay, Cuba is leased by the US and is part of Cuba; the base boundary is 28.5 km
Coastline: 19,924 km
Maritime claims: territorial sea: 12 nm
contiguous zone: 24 nm
exclusive economic zone: 200 nm
continental shelf: not specified
Climate: mostly temperate, but tropical in Hawaii and Florida, arctic in Alaska, semiarid in the great plains west of the Mississippi River, and arid in the Great Basin of the southwest; low winter temperatures in the northwest are ameliorated occasionally in January and February by warm chinook winds from the eastern slopes of the Rocky Mountains
note: many consider Denali, the highest peak in the US, to be the world’s coldest mountain because of its combination of high elevation and its subarctic location at 63 degrees north latitude; permanent snow and ice cover over 75 percent of the mountain, and enormous glaciers, up to 45 miles long and 3,700 feet thick, spider out from its base in every direction; it is home to some of the world’s coldest and most violent weather, where winds of over 150 miles per hour and temperatures of -93˚F have been recorded.
Terrain: vast central plain, mountains in west, hills and low mountains in east; rugged mountains and broad river valleys in Alaska; rugged, volcanic topography in Hawaii
Elevation: highest point: Denali 6,190 m (Mount McKinley) (highest point in North America)
lowest point: Death Valley (lowest point in North America) -86 m
mean elevation: 760 m
note: Denali is one of the most striking features on the entire planet; at 20,310 feet, it is the crowning peak of the Alaska Range and the highest mountain on North America; it towers three and one-half vertical miles above its base, making it a mile taller from base to summit than Mt. Everest; Denali’s base sits at about 2,000 feet above sea level and rises over three and one-half miles to its 20,310 foot summit; Everest begins on a 14,000-foot high plain, then summits at 29,028 feet.
note: the peak of Mauna Kea (4,207 m above sea level) on the island of Hawaii rises about 10,200 m above the Pacific Ocean floor; by this measurement, it is the world’s tallest mountain - higher than Mount Everest (8,850 m), which is recognized as the tallest mountain above sea level
Natural resources: coal, copper, lead, molybdenum, phosphates, rare earth elements, uranium, bauxite, gold, iron, mercury, nickel, potash, silver, tungsten, zinc, petroleum, natural gas, timber, arable land;
note 1: the US has the world’s largest coal reserves with 491 billion short tons accounting for 27% of the world’s total
note 2: the US is reliant on foreign imports for 100% of its needs for the following strategic resources: Arsenic, Cesium, Fluorspar, Gallium, Graphite, Indium, Manganese, Niobium, Rare Earths, Rubidium, Scandium, Tantalum, Yttrium; see Appendix H: Strategic Materials for further details
Land use: agricultural land: 44.5% (2018 est.)
arable land: 16.8% (2018 est.)
permanent crops: 0.3% (2018 est.)
permanent pasture: 27.4% (2018 est.)
forest: 33.3% (2018 est.)
other: 22.2% (2018 est.)
Irrigated land: 234,782 sq km (2017)
Major lakes (area sq km): fresh water lake(s): Michigan – 57,750 sq km; Superior* – 53,348 sq km; Huron* – 23,597 sq km; Erie* – 12,890 sq km; Ontario* – 9,220 sq km; Lake of the Woods – 4,350 sq km; Iliamna – 2,590 sq km; Okeechobee – 1,810 sq km; Belcharof – 1,190 sq km; Red – 1,170 sq km; Saint Clair – 1,113 sq km; Champlain – 1,100 sq km note - Great Lakes* area shown as US waters
salt water lake(s): Great Salt – 4,360 sq km; Pontchartrain – 1,620 sq km; Selawik – 1,400 sq km; Salton Sea – 950 sq km
Major rivers (by length in km): Missouri - 3,768 km; Mississippi - 3,544 km; Yukon river mouth (shared with Canada [s]) - 3,190 km; Saint Lawrence (shared with Canada) - 3,058 km; Rio Grande river source (mouth shared with Mexico) - 3,057 km; Colorado river source (shared with Mexico [m]) - 2,333 km; Arkansas - 2,348 km; Columbia river mouth (shared with Canada [s]) - 2,250 km; Red - 2,188 km; Ohio - 2,102 km; Snake - 1,670 km
note – [s] after country name indicates river source; [m] after country name indicates river mouth
Major watersheds (area sq km): Atlantic Ocean drainage: (Gulf of Mexico) Mississippi* (3,202,185 sq km); Rio Grande (607,965 sq km); (Gulf of Saint Lawrence) Saint Lawrence* (1,049,636 sq km total, US only 505,000 sq km)
Pacific Ocean drainage: Yukon* (847,620 sq km, US only 23,820 sq km); Colorado (703,148 sq km); Columbia* (657,501 sq km, US only 554,501 sq km)
note - watersheds shared with Canada shown with *
Major aquifers: Northern Great Plains Aquifer, Cambrian-Ordovician Aquifer System, Californian Central Valley Aquifer System, Ogallala Aquifer (High Plains), Atlantic and Gulf Coastal Plains Aquifer
Population distribution: large urban clusters are spread throughout the eastern half of the US (particularly the Great Lakes area, northeast, east, and southeast) and the western tier states; mountainous areas, principally the Rocky Mountains and Appalachian chain, deserts in the southwest, the dense boreal forests in the extreme north, and the central prarie states are less densely populated; Alaska’s population is concentrated along its southern coast - with particular emphasis on the city of Anchorage - and Hawaii’s is centered on the island of Oahu
Natural hazards: tsunamis; volcanoes; earthquake activity around Pacific Basin; hurricanes along the Atlantic and Gulf of Mexico coasts; tornadoes in the Midwest and Southeast; mud slides in California; forest fires in the west; flooding; permafrost in northern Alaska, a major impediment to development
volcanism: volcanic activity in the Hawaiian Islands, Western Alaska, the Pacific Northwest, and in the Northern Mariana Islands; both Mauna Loa (4,170 m) in Hawaii and Mount Rainier (4,392 m) in Washington have been deemed Decade Volcanoes by the International Association of Volcanology and Chemistry of the Earth’s Interior, worthy of study due to their explosive history and close proximity to human populations; Pavlof (2,519 m) is the most active volcano in Alaska’s Aleutian Arc and poses a significant threat to air travel since the area constitutes a major flight path between North America and East Asia; St. Helens (2,549 m), famous for the devastating 1980 eruption, remains active today; numerous other historically active volcanoes exist, mostly concentrated in the Aleutian arc and Hawaii; they include: in Alaska: Aniakchak, Augustine, Chiginagak, Fourpeaked, Iliamna, Katmai, Kupreanof, Martin, Novarupta, Redoubt, Spurr, Wrangell, Trident, Ugashik-Peulik, Ukinrek Maars, Veniaminof; in Hawaii: Haleakala, Kilauea, Loihi; in the Northern Mariana Islands: Anatahan; and in the Pacific Northwest: Mount Baker, Mount Hood; see note 2 under “Geography - note”
Geography - note: note 1: world’s third-largest country by size (after Russia and Canada) and by population (after China and India); Denali (Mt. McKinley) is the highest point (6,190 m) in North America and Death Valley the lowest point (-86 m) on the continent
note 2: the western coast of the United States and southern coast of Alaska lie along the Ring of Fire, a belt of active volcanoes and earthquake epicenters bordering the Pacific Ocean; up to 90% of the world’s earthquakes and some 75% of the world’s volcanoes occur within the Ring of Fire
note 3: the Aleutian Islands are a chain of volcanic islands that divide the Bering Sea (north) from the main Pacific Ocean (south); they extend about 1,800 km westward from the Alaskan Peninsula; the archipelago consists of 14 larger islands, 55 smaller islands, and hundreds of islets; there are 41 active volcanoes on the islands, which together form a large northern section of the Ring of Fire
note 4: Mammoth Cave, in west-central Kentucky, is the world’s longest known cave system with more than 650 km (405 miles) of surveyed passageways, which is nearly twice as long as the second-longest cave system, the Sac Actun underwater cave in Mexico - the world’s longest underwater cave system (see “Geography - note” under Mexico);
note 5: Kazumura Cave on the island of Hawaii is the world’s longest and deepest lava tube cave; it has been surveyed at 66 km (41 mi) long and 1,102 m (3,614 ft) deep
note 6: Bracken Cave outside of San Antonio, Texas is the world’s largest bat cave; it is the summer home to the largest colony of bats in the world; an estimated 20 million Mexican free-tailed bats roost in the cave from March to October making it the world’s largest known concentration of mammals
note 7: the US is reliant on foreign imports for 100% of its needs for the following strategic resources - Arsenic, Cesium, Fluorspar, Gallium, Graphite, Indium, Manganese, Niobium, Rare Earths, Rubidium, Scandium, Tantalum, Yttrium; see Appendix H: Strategic Materials for further details
note 8: three food crops are generally acknowledged to be native to areas of what is now the United States: cranberries, pecans, and sunflowers
PEOPLE AND SOCIETY
Population: 339,665,118 (2023 est.)
note: the US Census Bureau’s 2020 census results show the US population as 331,449,281 as of 1 April 2020
comparison ranking: 3
Nationality: noun: American(s)
adjective: American
Ethnic groups: White 61.6%, Black or African American 12.4%, Asian 6%, Amerindian and Alaska native 1.1%, Native Hawaiian and Other Pacific Islander 0.2%, other 8.4%, two or more races 10.2% (2020 est.)
note: a separate listing for Hispanic is not included because the US Census Bureau considers Hispanic to mean persons of Spanish/Hispanic/Latino origin including those of Mexican, Cuban, Puerto Rican, Dominican Republic, Spanish, and Central or South American origin living in the US who may be of any race or ethnic group (White, Black, Asian, etc.); an estimated 18.7% of the total US population is Hispanic as of 2020
Languages: English only 78.2%, Spanish 13.4%, Chinese 1.1%, other 7.3% (2017 est.)
note: data represent the language spoken at home; the US has no official national language, but English has acquired official status in 32 of the 50 states; Hawaiian is an official language in the state of Hawaii, and 20 indigenous languages are official in Alaska
Religions: Protestant 46.5%, Roman Catholic 20.8%, Jewish 1.9%, Church of Jesus Christ 1.6%, other Christian 0.9%, Muslim 0.9%, Jehovah’s Witness 0.8%, Buddhist 0.7%, Hindu 0.7%, other 1.8%, unaffiliated 22.8%, don’t know/refused 0.6% (2014 est.)
Age structure: 0-14 years: 18.15% (male 31,509,186/female 30,154,408)
15-64 years: 63.72% (male 108,346,275/female 108,100,830)
65 years and over: 18.12% (2023 est.) (male 27,589,149/female 33,965,270)
Dependency ratios: total dependency ratio: 53.7
youth dependency ratio: 28
elderly dependency ratio: 25.6
potential support ratio: 3.9 (2021 est.)
Median age: total: 38.5 years (2020)
male: 37.2 years
female: 39.8 years
comparison ranking: total 68
Population growth rate: 0.68% (2023 est.)
comparison ranking: 130
Birth rate: 12.2 births/1,000 population (2023 est.)
comparison ranking: 148
Death rate: 8.4 deaths/1,000 population (2023 est.)
comparison ranking: 74
Net migration rate: 3 migrant(s)/1,000 population (2023 est.)
comparison ranking: 43
Population distribution: large urban clusters are spread throughout the eastern half of the US (particularly the Great Lakes area, northeast, east, and southeast) and the western tier states; mountainous areas, principally the Rocky Mountains and Appalachian chain, deserts in the southwest, the dense boreal forests in the extreme north, and the central prarie states are less densely populated; Alaska’s population is concentrated along its southern coast - with particular emphasis on the city of Anchorage - and Hawaii’s is centered on the island of Oahu
Urbanization: urban population: 83.3% of total population (2023)
rate of urbanization: 0.96% annual rate of change (2020-25 est.)
Major urban areas - population: 18.937 million New York-Newark, 12.534 million Los Angeles-Long Beach-Santa Ana, 8.937 million Chicago, 6.707 million Houston, 6.574 million Dallas-Fort Worth, 5.490 million WASHINGTON, D.C. (capital) (2023)
Sex ratio: at birth: 1.05 male(s)/female
0-14 years: 1.04 male(s)/female
15-64 years: 1 male(s)/female
65 years and over: 0.81 male(s)/female
total population: 0.97 male(s)/female (2023 est.)
Mother’s mean age at first birth: 27 years (2019 est.)
Maternal mortality ratio: 21 deaths/100,000 live births (2020 est.)
comparison ranking: 122
Infant mortality rate: total: 5.1 deaths/1,000 live births (2023 est.)
male: 5.5 deaths/1,000 live births
female: 4.7 deaths/1,000 live births
comparison ranking: total 174
Life expectancy at birth: total population: 80.8 years (2023 est.)
male: 78.5 years
female: 82.9 years
comparison ranking: total population 48
Total fertility rate: 1.84 children born/woman (2023 est.)
comparison ranking: 134
Gross reproduction rate: 0.9 (2023 est.)
Contraceptive prevalence rate: 73.9% (2017/19)
Drinking water source: improved: urban: 99.9% of population
rural: 99.7% of population
total: 99.9% of population
unimproved: urban: 0.1% of population
rural: 0.3% of population
total: 0.1% of population (2020 est.)
Current health expenditure: 18.8% of GDP (2020)
Physicians density: 2.61 physicians/1,000 population (2018)
Hospital bed density: 2.9 beds/1,000 population (2017)
Sanitation facility access: improved: urban: 99.8% of population
rural: 98.9% of population
total: 99.7% of population
unimproved: urban: 0.2% of population
rural: 11.1% of population
total: 0.3% of population (2020 est.)
Obesity - adult prevalence rate: 36.2% (2016)
comparison ranking: 12
Alcohol consumption per capita: total: 8.93 liters of pure alcohol (2019 est.)
beer: 3.97 liters of pure alcohol (2019 est.)
wine: 1.67 liters of pure alcohol (2019 est.)
spirits: 3.29 liters of pure alcohol (2019 est.)
other alcohols: 0 liters of pure alcohol (2019 est.)
comparison ranking: total 35
Tobacco use: total: 23% (2020 est.)
male: 28.4% (2020 est.)
female: 17.5% (2020 est.)
comparison ranking: total 66
Children under the age of 5 years underweight: 0.4% (2017/18)
comparison ranking: 125
Currently married women (ages 15-49): 51.9% (2023 est.)
Education expenditures: 6.1% of GDP (2020 est.)
comparison ranking: 40
School life expectancy (primary to tertiary education): total: 16 years
male: 16 years
female: 17 years (2020)
Youth unemployment rate (ages 15-24): total: 9.6% (2021 est.)
male: 10.5%
female: 8.6%
comparison ranking: total 159
ENVIRONMENT
Environment - current issues: air pollution; large emitter of carbon dioxide from the burning of fossil fuels; water pollution from runoff of pesticides and fertilizers; declining natural freshwater resources in much of the western part of the country require careful management; deforestation; mining; desertification; species conservation; invasive species (the Hawaiian Islands are particularly vulnerable)
Environment - international agreements: party to: Air Pollution, Air Pollution-Heavy Metals, Air Pollution-Multi-effect Protocol, Air Pollution-Nitrogen Oxides, Antarctic-Environmental Protection, Antarctic-Marine Living Resources, Antarctic Seals, Antarctic Treaty, Climate Change, Climate Change-Paris Agreement, Desertification, Endangered Species, Environmental Modification, Marine Dumping-London Convention, Marine Life Conservation, Nuclear Test Ban, Ozone Layer Protection, Ship Pollution, Tropical Timber 2006, Wetlands, Whaling
signed, but not ratified: Air Pollution-Persistent Organic Pollutants, Air Pollution-Volatile Organic Compounds, Biodiversity, Climate Change-Kyoto Protocol, Comprehensive Nuclear Test Ban, Hazardous Wastes, Marine Dumping-London Protocol
Climate: mostly temperate, but tropical in Hawaii and Florida, arctic in Alaska, semiarid in the great plains west of the Mississippi River, and arid in the Great Basin of the southwest; low winter temperatures in the northwest are ameliorated occasionally in January and February by warm chinook winds from the eastern slopes of the Rocky Mountains
note: many consider Denali, the highest peak in the US, to be the world’s coldest mountain because of its combination of high elevation and its subarctic location at 63 degrees north latitude; permanent snow and ice cover over 75 percent of the mountain, and enormous glaciers, up to 45 miles long and 3,700 feet thick, spider out from its base in every direction; it is home to some of the world’s coldest and most violent weather, where winds of over 150 miles per hour and temperatures of -93˚F have been recorded.
Land use: agricultural land: 44.5% (2018 est.)
arable land: 16.8% (2018 est.)
permanent crops: 0.3% (2018 est.)
permanent pasture: 27.4% (2018 est.)
forest: 33.3% (2018 est.)
other: 22.2% (2018 est.)
Urbanization: urban population: 83.3% of total population (2023)
rate of urbanization: 0.96% annual rate of change (2020-25 est.)
Revenue from forest resources: 0.04% of GDP (2018 est.)
comparison ranking: 132
Revenue from coal: 0.2% of GDP (2018 est.)
comparison ranking: 22
Air pollutants: particulate matter emissions: 7.18 micrograms per cubic meter (2019 est.)
carbon dioxide emissions: 5,006.3 megatons (2016 est.)
methane emissions: 685.74 megatons (2020 est.)
Waste and recycling: municipal solid waste generated annually: 258 million tons (2015 est.)
municipal solid waste recycled annually: 89.268 million tons (2014 est.)
percent of municipal solid waste recycled: 34.6% (2014 est.)
Major lakes (area sq km): fresh water lake(s): Michigan – 57,750 sq km; Superior* – 53,348 sq km; Huron* – 23,597 sq km; Erie* – 12,890 sq km;
Ontario* – 9,220 sq km; Lake of the Woods – 4,350 sq km; Iliamna – 2,590 sq km; Okeechobee – 1,810 sq km;
Belcharof – 1,190 sq km; Red – 1,170 sq km; Saint Clair – 1,113 sq km; Champlain – 1,100 sq km note - Great Lakes* area shown as US waters
salt water lake(s): Great Salt – 4,360 sq km; Pontchartrain – 1,620 sq km; Selawik – 1,400 sq km; Salton Sea – 950 sq km
Major rivers (by length in km): Missouri - 3,768 km; Mississippi - 3,544 km; Yukon river mouth (shared with Canada [s]) - 3,190 km; Saint Lawrence (shared with Canada) - 3,058 km; Rio Grande river source (mouth shared with Mexico) - 3,057 km; Colorado river source (shared with Mexico [m]) - 2,333 km; Arkansas - 2,348 km; Columbia river mouth (shared with Canada [s]) - 2,250 km; Red - 2,188 km; Ohio - 2,102 km; Snake - 1,670 km
note – [s] after country name indicates river source; [m] after country name indicates river mouth
Major watersheds (area sq km): Atlantic Ocean drainage: (Gulf of Mexico) Mississippi* (3,202,185 sq km); Rio Grande (607,965 sq km); (Gulf of Saint Lawrence) Saint Lawrence* (1,049,636 sq km total, US only 505,000 sq km)
Pacific Ocean drainage: Yukon* (847,620 sq km, US only 23,820 sq km); Colorado (703,148 sq km); Columbia* (657,501 sq km, US only 554,501 sq km)
note - watersheds shared with Canada shown with *
Major aquifers: Northern Great Plains Aquifer, Cambrian-Ordovician Aquifer System, Californian Central Valley Aquifer System, Ogallala Aquifer (High Plains), Atlantic and Gulf Coastal Plains Aquifer
Total water withdrawal: municipal: 58.39 billion cubic meters (2020 est.)
industrial: 209.7 billion cubic meters (2020 est.)
agricultural: 176.2 billion cubic meters (2020 est.)
Total renewable water resources: 3.07 trillion cubic meters (2020 est.)
GOVERNMENT
Country name: conventional long form: United States of America
conventional short form: United States
abbreviation: US or USA
etymology: the name America is derived from that of Amerigo VESPUCCI (1454-1512) - Italian explorer, navigator, and cartographer - using the Latin form of his name, Americus, feminized to America
Government type: constitutional federal republic
Capital: name: Washington, DC
geographic coordinates: 38 53 N, 77 02 W
time difference: UTC-5 (during Standard Time)
daylight saving time: +1hr, begins second Sunday in March; ends first Sunday in November
time zone note: the 50 United States cover six time zones
etymology: named after George WASHINGTON (1732-1799), the first president of the United States
Administrative divisions: 50 states and 1 district*; Alabama, Alaska, Arizona, Arkansas, California, Colorado, Connecticut, Delaware, District of Columbia*, Florida, Georgia, Hawaii, Idaho, Illinois, Indiana, Iowa, Kansas, Kentucky, Louisiana, Maine, Maryland, Massachusetts, Michigan, Minnesota, Mississippi, Missouri, Montana, Nebraska, Nevada, New Hampshire, New Jersey, New Mexico, New York, North Carolina, North Dakota, Ohio, Oklahoma, Oregon, Pennsylvania, Rhode Island, South Carolina, South Dakota, Tennessee, Texas, Utah, Vermont, Virginia, Washington, West Virginia, Wisconsin, Wyoming
Dependent areas: American Samoa, Baker Island, Guam, Howland Island, Jarvis Island, Johnston Atoll, Kingman Reef, Midway Islands, Navassa Island, Northern Mariana Islands, Palmyra Atoll, Puerto Rico, Virgin Islands, Wake Island (14)
note: from 18 July 1947 until 1 October 1994, the US administered the Trust Territory of the Pacific Islands; it entered into a political relationship with all four political entities: the Northern Mariana Islands is a commonwealth in political union with the US (effective 3 November 1986); the Republic of the Marshall Islands signed a Compact of Free Association with the US (effective 21 October 1986); the Federated States of Micronesia signed a Compact of Free Association with the US (effective 3 November 1986); Palau concluded a Compact of Free Association with the US (effective 1 October 1994)
Independence: 4 July 1776 (declared independence from Great Britain); 3 September 1783 (recognized by Great Britain)
National holiday: Independence Day, 4 July (1776)
Constitution: history: previous 1781 (Articles of Confederation and Perpetual Union); latest drafted July - September 1787, submitted to the Congress of the Confederation 20 September 1787, submitted for states’ ratification 28 September 1787, ratification completed by nine of the 13 states 21 June 1788, effective 4 March 1789
amendments: proposed as a “joint resolution” by Congress, which requires a two-thirds majority vote in both the House of Representatives and the Senate or by a constitutional convention called for by at least two thirds of the state legislatures; passage requires ratification by three fourths of the state legislatures or passage in state-held constitutional conventions as specified by Congress; the US president has no role in the constitutional amendment process; amended many times, last in 1992
Legal system: common law system based on English common law at the federal level; state legal systems based on common law, except Louisiana, where state law is based on Napoleonic civil code; judicial review of legislative acts
International law organization participation: withdrew acceptance of compulsory ICJ jurisdiction in 2005; withdrew acceptance of ICCt jurisdiction in 2002
Citizenship: citizenship by birth: yes
citizenship by descent only: yes
dual citizenship recognized: no, but the US government acknowledges such situtations exist; US citizens are not encouraged to seek dual citizenship since it limits protection by the US
residency requirement for naturalization: 5 years
Suffrage: 18 years of age; universal
Executive branch: chief of state: President Joseph R. BIDEN, Jr. (since 20 January 2021); Vice President Kamala D. HARRIS (since 20 January 2021); note - the president is both chief of state and head of government
head of government: President Joseph R. BIDEN, Jr. (since 20 January 2021); Vice President Kamala D. HARRIS (since 20 January 2021)
cabinet: Cabinet appointed by the president, approved by the Senate
elections/appointments: president and vice president indirectly elected on the same ballot by the Electoral College of ‘electors’ chosen from each state; president and vice president serve a 4-year term (eligible for a second term); election last held on 3 November 2020 (next to be held on 5 November 2024)
election results: 2020: Joseph R. BIDEN, Jr. elected president; electoral vote - Joseph R. BIDEN, Jr. (Democratic Party) 306, Donald J. TRUMP (Republican Party) 232; percent of direct popular vote - Joseph R. BIDEN Jr. 51.3%, Donald J. TRUMP 46.9%, other 1.8%
2016: Donald J. TRUMP elected president; electoral vote - Donald J. TRUMP (Republican Party) 304, Hillary D. CLINTON (Democratic Party) 227, other 7; percent of direct popular vote - Hillary D. CLINTON 48.2%, Donald J. TRUMP 46.1%, other 5.7%
Legislative branch: description: bicameral Congress consists of:
Senate (100 seats; 2 members directly elected in each of the 50 state constituencies by simple majority vote except in Georgia and Louisiana which require an absolute majority vote with a second round if needed; members serve 6-year terms with one-third of membership renewed every 2 years)
House of Representatives (435 seats; members directly elected in single-seat constituencies by simple majority vote except in Georgia which requires an absolute majority vote with a second round if needed; members serve 2-year terms)
elections: Senate - last held on 8 November 2022 (next to be held on 5 November 2024)
House of Representatives - last held on 8 November 2022 (next to be held on 5 November 2024)
election results: Senate - percent of vote by party - NA; seats by party - Democratic Party 51, Republican Party 49; composition - men 75, women 25, percent of women 25%
House of Representatives - percent of vote by party - NA; seats by party - Republican Party 222, Democratic Party 213; composition - men 307, women 128, percent of women 29.4%; note - total US Congress percent of women 28.6%
note: in addition to the regular members of the House of Representatives there are 6 non-voting delegates elected from the District of Columbia and the US territories of American Samoa, Guam, Puerto Rico, the Northern Mariana Islands, and the Virgin Islands; these are single seat constituencies directly elected by simple majority vote to serve a 2-year term (except for the resident commissioner of Puerto Rico who serves a 4-year term); the delegate can vote when serving on a committee and when the House meets as the Committee of the Whole House, but not when legislation is submitted for a “full floor” House vote; election of delegates last held on 8 November 2022 (next to be held on 3 November 2024)
Judicial branch: highest court(s): US Supreme Court (consists of 9 justices - the chief justice and 8 associate justices)
judge selection and term of office: president nominates and, with the advice and consent of the Senate, appoints Supreme Court justices; justices serve for life
subordinate courts: Courts of Appeal (includes the US Court of Appeal for the Federal District and 12 regional appeals courts); 94 federal district courts in 50 states and territories
note: the US court system consists of the federal court system and the state court systems; although each court system is responsible for hearing certain types of cases, neither is completely independent of the other, and the systems often interact
Political parties and leaders: Democratic Party [Jaime HARRISON]
Green Party [collective leadership]
Libertarian Party [Angela McARDLE]
Republican Party [Ronna Romney MCDANIEL]
International organization participation: ADB (nonregional member), AfDB (nonregional member), ANZUS, APEC, Arctic Council, ARF, ASEAN (dialogue partner), Australia Group, BIS, BSEC (observer), CBSS (observer), CD, CE (observer), CERN (observer), CICA (observer), CP, EAPC, EAS, EBRD, EITI (implementing country), FAO, FATF, G-5, G-7, G-8, G-10, G-20, IADB, IAEA, IBRD, ICAO, ICC (national committees), ICRM, IDA, IEA, IFAD, IFC, IFRCS, IGAD (partners), IHO, ILO, IMF, IMO, IMSO, Interpol, IOC, IOM, ISO, ITSO, ITU, ITUC (NGOs), MIGA, MINUSMA, MINUSTAH, MONUSCO, NAFTA, NATO, NEA, NSG, OAS, OECD, OPCW, OSCE, Pacific Alliance (observer), Paris Club, PCA, PIF (partner), Quad, SAARC (observer), SELEC (observer), SICA (observer), SPC, UN, UNCTAD, UNESCO, UNHCR, UNHRC, UNITAR, UNMIL, UNMISS, UNRWA, UN Security Council (permanent), UNTSO, UPU, USMCA, Wassenaar Arrangement, WCO, WHO, WIPO, WMO, WTO, ZC
Flag description: 13 equal horizontal stripes of red (top and bottom) alternating with white; there is a blue rectangle in the upper hoist-side corner bearing 50 small, white, five-pointed stars arranged in nine offset horizontal rows of six stars (top and bottom) alternating with rows of five stars; the 50 stars represent the 50 states, the 13 stripes represent the 13 original colonies; blue stands for loyalty, devotion, truth, justice, and friendship, red symbolizes courage, zeal, and fervency, while white denotes purity and rectitude of conduct; commonly referred to by its nickname of Old Glory
note: the design and colors have been the basis for a number of other flags, including Chile, Liberia, Malaysia, and Puerto Rico
National symbol(s): bald eagle; national colors: red, white, blue
National anthem: name: “The Star-Spangled Banner”
lyrics/music: Francis Scott KEY/John Stafford SMITH
note: adopted 1931; during the War of 1812, after witnessing the successful American defense of Fort McHenry in Baltimore following British naval bombardment, Francis Scott KEY wrote the lyrics to what would become the national anthem; the lyrics were set to the tune of “The Anacreontic Song”; only the first verse is sung
National heritage: total World Heritage Sites: 24 (11 cultural, 12 natural, 1 mixed); note - includes one site in Puerto Rico
selected World Heritage Site locales: Yellowstone National Park (n); Grand Canyon National Park (n); Cahokia Mounds State Historic Site (c); Independence Hall (c); Statue of Liberty (c); Yosemite National Park (n); Papahānaumokuākea (m); Monumental Earthworks of Poverty Point (c); The 20th-Century Architecture of Frank Lloyd Wright (c); Mesa Verde National Park (c); Mammoth Cave National Park (n); Monticello (c); Olympic National Park (n)
ECONOMY
Economic overview: high-income, diversified North American economy; NATO leader; largest importer and second-largest exporter; home to leading financial exchanges; high and growing public debt; rising socioeconomic inequalities; historically low interest rates; hit by COVID-19
Real GDP (purchasing power parity): $21.132 trillion (2021 est.)
$19.946 trillion (2020 est.)
$20.513 trillion (2019 est.)
note: data are in 2017 dollars
comparison ranking: 2
Real GDP growth rate: 5.95% (2021 est.)
-2.77% (2020 est.)
2.29% (2019 est.)
comparison ranking: 75
Real GDP per capita: $63,700 (2021 est.)
$60,200 (2020 est.)
$62,500 (2019 est.)
note: data are in 2017 dollars
comparison ranking: 15
GDP (official exchange rate): $21,433,228,000,000 (2019 est.)
Inflation rate (consumer prices): 4.7% (2021 est.)
1.23% (2020 est.)
1.81% (2019 est.)
comparison ranking: 72
Credit ratings:
Fitch rating: AAA (1994)
Moody’s rating: Aaa (1949)
Standard & Poors rating: AA+ (2011)
note: The year refers to the year in which the current credit rating was first obtained.
GDP - composition, by sector of origin: agriculture: 0.9% (2017 est.)
industry: 19.1% (2017 est.)
services: 80% (2017 est.)
comparison rankings: services 32; industry 158; agriculture 202
GDP - composition, by end use: household consumption: 68.4% (2017 est.)
government consumption: 17.3% (2017 est.)
investment in fixed capital: 17.2% (2017 est.)
investment in inventories: 0.1% (2017 est.)
exports of goods and services: 12.1% (2017 est.)
imports of goods and services: -15% (2017 est.)
Agricultural products: maize, milk, soybeans, wheat, sugar cane, sugar beet, poultry, potatoes, cotton, pork
Industries: highly diversified, world leading, high-technology innovator, second-largest industrial output in the world; petroleum, steel, motor vehicles, aerospace, telecommunications, chemicals, electronics, food processing, consumer goods, lumber, mining
Industrial production growth rate: 3.25% (2021 est.)
comparison ranking: 119
Labor force: 164.797 million (2021 est.)
note: includes unemployed
comparison ranking: 3
Labor force - by occupation: agriculture: 0.7% (2009)
industry: 20.3% (2009)
services: 37.3% (2009)
industry and services: 24.2% (2009)
manufacturing: 17.6% (2009)
farming, forestry, and fishing: 0.7% (2009)
manufacturing, extraction, transportation, and crafts: 20.3% (2009)
managerial, professional, and technical: 37.3% (2009)
sales and office: 24.2% (2009)
other services: 17.6% (2009)
note: figures exclude the unemployed
Unemployment rate: 5.46% (2021 est.)
8.05% (2020 est.)
3.67% (2019 est.)
comparison ranking: 134
Youth unemployment rate (ages 15-24): total: 9.6% (2021 est.)
male: 10.5%
female: 8.6%
comparison ranking: total 159
Population below poverty line: 15.1% (2010 est.)
Gini Index coefficient - distribution of family income: 41.5 (2019 est.)
comparison ranking: 46
Average household expenditures: on food: 6.4% of household expenditures (2018 est.)
on alcohol and tobacco: 1.7% of household expenditures (2018 est.)
Household income or consumption by percentage share: lowest 10%: 2%
highest 10%: 30% (2007 est.)
Budget: revenues: $6.429 trillion (2019 est.)
expenditures: $7.647 trillion (2019 est.)
Budget surplus (+) or deficit (-): -3.4% (of GDP) (2017 est.)
comparison ranking: 144
Public debt: 126.39% of GDP (2020 est.)
100.9% of GDP (2019 est.)
99.15% of GDP (2018 est.)
note: data cover only what the United States Treasury denotes as “Debt Held by the Public,” which includes all debt instruments issued by the Treasury that are owned by non-US Government entities; the data include Treasury debt held by foreign entities; the data exclude debt issued by individual US states, as well as intragovernmental debt; intragovernmental debt consists of Treasury borrowings from surpluses in the trusts for Federal Social Security, Federal Employees, Hospital and Supplemental Medical Insurance (Medicare), Disability and Unemployment, and several other smaller trusts; if data for intragovernment debt were added, “gross debt” would increase by about one-third of GDP
comparison ranking: 11
Taxes and other revenues: 9.86% (of GDP) (2020 est.)
note: excludes contributions for social security and other programs; if social contributions were added, taxes and other revenues would amount to approximately 22% of GDP
comparison ranking: 194
Fiscal year: 1 October - 30 September
Current account balance: -$846.354 billion (2021 est.)
-$619.702 billion (2020 est.)
-$445.955 billion (2019 est.)
comparison ranking: 209
Exports: $2.557 trillion (2021 est.) note: data are in current year dollars
$2.159 trillion (2020 est.) note: data are in current year dollars
$2.546 trillion (2019 est.) note: data are in current year dollars
comparison ranking: 2
Exports - partners: Canada 16%, Mexico 15%, China 9%, Japan 4%, South Korea 4% (2021)
Exports - commodities: refined petroleum, natural gas, crude petroleum, cars and vehicle parts, integrated circuits, aircraft, vaccines and cultures (2021)
Imports: $3.402 trillion (2021 est.) note: data are in current year dollars
$2.813 trillion (2020 est.) note: data are in current year dollars
$3.106 trillion (2019 est.) note: data are in current year dollars
comparison ranking: 1
Imports - partners: China 19%, Mexico 13%, Canada 13%, Germany 5%, Japan 5% (2021)
Imports - commodities: cars, crude petroleum, computers, broadcasting equipment, packaged medicines (2021)
Reserves of foreign exchange and gold: $716.152 billion (31 December 2021 est.)
$628.37 billion (31 December 2020 est.)
$516.701 billion (31 December 2019 est.)
comparison ranking: 4
Debt - external: $20,275,951,000,000 (2019 est.)
$19,452,478,000,000 (2018 est.)
note: approximately 4/5ths of US external debt is denominated in US dollars; foreign lenders have been willing to hold US dollar denominated debt instruments because they view the dollar as the world’s reserve currency
comparison ranking: 1
Exchange rates: British pounds per US dollar: 0.7836 (2017 est.), 0.738 (2016 est.), 0.738 (2015 est.), 0.607 (2014 est), 0.6391 (2013 est.)
Canadian dollars per US dollar: 1, 1.308 (2017 est.), 1.3256 (2016 est.), 1.3256 (2015 est.), 1.2788 (2014 est.), 1.0298 (2013 est.)
Chinese yuan per US dollar: 1, 6.7588 (2017 est.), 6.6445 (2016 est.), 6.2275 (2015 est.), 6.1434 (2014 est.), 6.1958 (2013 est.)
euros per US dollar: 0.885 (2017 est.), 0.903 (2016 est.), 0.9214(2015 est.), 0.885 (2014 est.), 0.7634 (2013 est.)
Japanese yen per US dollar: 111.10 (2017 est.), 108.76 (2016 est.), 108.76 (2015 est.), 121.02 (2014 est.), 97.44 (2013 est.)
note 1: the following countries and territories use the US dollar officially as their legal tender: British Virgin Islands, Ecuador, El Salvador, Marshall Islands, Micronesia, Palau, Timor Leste, Turks and Caicos, and islands of the Caribbean Netherlands (Bonaire, Sint Eustatius, and Saba)
note 2: the following countries and territories use the US dollar as official legal tender alongside local currency: Bahamas, Barbados, Belize, Costa Rica, and Panama
note 3: the following countries and territories widely accept the US dollar as a dominant currency but have yet to declare it as legal tender: Bermuda, Burma, Cambodia, Cayman Islands, Honduras, Nicaragua, and Somalia
Exchange rates: 1 (2021 est.)
1 (2020 est.)
1 (2019 est.)
1 (2018 est.)
1 (2017 est.)
ENERGY
Electricity access: electrification - total population: 100% (2021)
Electricity: installed generating capacity: 1,143,266,000 kW (2020 est.)
consumption: 3,897,886,551,000 kWh (2020 est.)
exports: 14,134,679,000 kWh (2020 est.)
imports: 61,448,863,000 kWh (2020 est.)
transmission/distribution losses: 198,085,480,000 kWh (2020 est.)
comparison rankings: transmission/distribution losses 3; imports 1; exports 15; consumption 2; installed generating capacity 2
Electricity generation sources: fossil fuels: 59.9% of total installed capacity (2020 est.)
nuclear: 19.5% of total installed capacity (2020 est.)
solar: 3.2% of total installed capacity (2020 est.)
wind: 8.3% of total installed capacity (2020 est.)
hydroelectricity: 7% of total installed capacity (2020 est.)
geothermal: 0.4% of total installed capacity (2020 est.)
biomass and waste: 1.7% of total installed capacity (2020 est.)
Nuclear energy: Number of operational nuclear reactors: 93 (2023)
Number of nuclear reactors under construction: 1
Net capacity of operational nuclear reactors: 95.83GW (2021)
Percent of total electricity production: 20% (2021)
Percent of total energy produced: 8.2% (2021)
Number of nuclear reactors permanently shut down: 20
note: The US has the World’s largest nuclear energy program with 26% of the World’s net capacity of nuclear reactors
Coal: production: 495.13 million metric tons (2020 est.)
consumption: 441.968 million metric tons (2020 est.)
exports: 63.276 million metric tons (2020 est.)
imports: 4.808 million metric tons (2020 est.)
proven reserves: 228.662 billion metric tons (2019 est.)
Petroleum: total petroleum production: 17,924,200 bbl/day (2021 est.)
refined petroleum consumption: 20,542,900 bbl/day (2019 est.)
crude oil and lease condensate exports: 2,048,100 bbl/day (2018 est.)
crude oil and lease condensate imports: 7,768,500 bbl/day (2018 est.)
crude oil estimated reserves: 47.107 billion barrels (2020 est.)
Refined petroleum products - production: 20.3 million bbl/day (2017 est.)
comparison ranking: 1
Refined petroleum products - exports: 5.218 million bbl/day (2017 est.)
comparison ranking: 1
Refined petroleum products - imports: 2.175 million bbl/day (2017 est.)
comparison ranking: 2
Natural gas: production: 967,144,362,000 cubic meters (2021 est.)
consumption: 857,542,658,000 cubic meters (2021 est.)
exports: 188,401,779,000 cubic meters (2021 est.)
imports: 79,512,470,000 cubic meters (2021 est.)
proven reserves: 13,178,780,000,000 cubic meters (2020 est.)
Carbon dioxide emissions: 5,144,361,000 metric tonnes of CO2 (2019 est.)
from coal and metallurgical coke: 1,077,520,000 metric tonnes of CO2 (2019 est.)
from petroleum and other liquids: 2,382,833,000 metric tonnes of CO2 (2019 est.)
from consumed natural gas: 1,684,008,000 metric tonnes of CO2 (2019 est.)
comparison ranking: total emissions 2
Energy consumption per capita: 304.414 million Btu/person (2019 est.)
comparison ranking: 11
COMMUNICATIONS
Telephones - fixed lines: total subscriptions: 98 million (2021 est.)
subscriptions per 100 inhabitants: 29 (2021 est.)
comparison ranking: total subscriptions 2
Telephones - mobile cellular: total subscriptions: 360 million (2021 est.)
subscriptions per 100 inhabitants: 110 (2021 est.)
comparison ranking: total subscriptions 4
Telecommunication systems: general assessment: the US telecom sector adapted well to the particular demands of the pandemic, which has led to strong growth in the number of mobile, mobile broadband, and fixed broadband subscribers since 2020; the level of growth is expected to taper off from late 2022 as the demand for working and schooling from home subsides; the pandemic also encouraged the Federal government to increase its investment in broadband infrastructure; of particular note was the Infrastructure Investment and Jobs Act of November 2021, which provided $65 billion to a range of programs aimed at delivering broadband to unserved areas, providing fiber-based broadband to upgrade existing service areas, and subsidizing the cost of services to low income households; alongside these fiscal efforts have been the several spectrum auctions undertaken during the last two years, which have greatly assisted the main licensees to improve the reach and quality of their offers based on LTE and 5G; some of this spectrum, auctioned during 2021, was only made available to licensees from February 2022; the widening availability of 5G from the main providers has resulted in a dramatic increase in mobile data traffic; in tandem with the focus on 5G, operators have closed down their GSM and CDMA networks, and have either closed down 3G networks (as AT&T did in January 2022), or plan to in coming months; given the size of the US broadband market, and the growing demand for data on both fixed and mobile networks, there is continuous pressure for operators to invest in fiber networks, and to push connectivity closer to consumers; in recent years the US has seen increased activity from regional players as well as the major telcos and cablecos; although there has been considerable investment in DOCSIS4.0, some of the cablecos are looking to ditch HFC in preference for fiber broadband; the process of migrating from copper (HFC and DSL) to fiber is ongoing, but given the scale of the work involved it will take some years; some operators have investment strategies in place through to 2025, which will see the vast majority of their fixed networks being entirely on fiber; service offerings of up to 2Gb/s are becoming more widely available as the process continues (2022)
domestic: fixed-line just over 29 per 100 and mobile-cellular is 110 per 100 (2021)
international: country code - 1; landing points for the Quintillion Subsea Cable Network, TERRA SW, AU-Aleutian, KKFL, AKORN, Alaska United -West, & -East & -Southeast, North Star, Lynn Canal Fiber, KetchCar 1, PC-1, SCCN, Tat TGN-Pacific & -Atlantic, Jupiter, Hawaiki, NCP, FASTER, HKA, JUS, AAG, BtoBE, Currie, Southern Cross NEXT, SxS, PLCN, Utility EAC-Pacific, SEA-US, Paniolo Cable Network, HICS, HIFN, ASH, Telstra Endeavor, Honotua, AURORA, ARCOS, AMX-1, Americas -I & -II, Columbus IIb & -III, Maya-1, MAC, GTMO-1, BICS, CFX-1, GlobeNet, Monet, SAm-1, Bahamas 2, PCCS, BRUSA, Dunant, MAREA, SAE x1, TAT 14, Apollo, Gemini Bermuda, Havfrue/AEC-2, Seabras-1, WALL-LI, NYNJ-1, FLAG Atalantic-1, Yellow, Atlantic Crossing-1, AE Connect -1, sea-2shore, Challenger Bermuda-1, and GTT Atlantic submarine cable systems providing international connectivity to Europe, Africa, the Middle East, Asia, Southeast Asia, Australia, New Zealand, Pacific, & Atlantic, and Indian Ocean Islands, Central and South America, Caribbean, Canada and US; satellite earth stations - 61 Intelsat (45 Atlantic Ocean and 16 Pacific Ocean), 5 Intersputnik (Atlantic Ocean region), and 4 Inmarsat (Pacific and Atlantic Ocean regions) (2020)
Broadcast media: 4 major terrestrial TV networks with affiliate stations throughout the country, plus cable and satellite networks, independent stations, and a limited public broadcasting sector that is largely supported by private grants; overall, thousands of TV stations broadcasting; multiple national radio networks with many affiliate stations; while most stations are commercial, National Public Radio (NPR) has a network of some 900 member stations; satellite radio available; in total, over 15,000 radio stations operating (2018)
Internet country code: .us
Internet users: total: 312.8 million (2021 est.)
percent of population: 92% (2021 est.)
comparison ranking: total 3
Broadband - fixed subscriptions: total: 121.176 million (2020 est.)
subscriptions per 100 inhabitants: 37 (2020 est.)
comparison ranking: total 2
Communications - note: note 1: The Library of Congress, Washington DC, USA, claims to be the largest library in the world with more than 167 million items (as of 2018); its collections are universal, not limited by subject, format, or national boundary, and include materials from all parts of the world and in over 450 languages; collections include: books, newspapers, magazines, sheet music, sound and video recordings, photographic images, artwork, architectural drawings, and copyright data
note 2: Cape Canaveral, Florida, USA, hosts one of four dedicated ground antennas that assist in the operation of the Global Positioning System (GPS) navigation system (the others are on Ascension (Saint Helena, Ascension, and Tistan da Cunha), Diego Garcia (British Indian Ocean Territory), and at Kwajalein (Marshall Islands)
TRANSPORTATION
National air transport system: number of registered air carriers: 99 (2020)
inventory of registered aircraft operated by air carriers: 7,249
annual passenger traffic on registered air carriers: 889.022 million (2018)
annual freight traffic on registered air carriers: 42,985,300,000 (2018) mt-km
Civil aircraft registration country code prefix: N
Airports: 13,513 (2022)
note - 24.5% of airports are public
comparison ranking: total 1
Airports - with paved runways: 5,054
civil airports: 1,606
military airports: 162
joint use (civil-military) airports: 31
other airports: 3,255
note: paved runways have a concrete or asphalt surface but not all have facilities for refueling, maintenance, or air traffic control; the length of a runway required for aircraft to safely operate depends on a number of factors including the type of aircraft, the takeoff weight (including passengers, cargo, and fuel), engine types, flap settings, landing speed, elevation of the airport, and average maximum daily air temperature; paved runways can reach a length of 5,000 m (16,000 ft.), but the “typical” length of a commercial airline runway is between 2,500-4,000 m (8,000-13,000 ft.)
Airports - with unpaved runways: 8,459
note: unpaved runways have a surface composition such as grass or packed earth and are most suited to the operation of light aircraft; unpaved runways are usually short, often less than 1,000 m (3,280 ft.) in length; airports with unpaved runways often lack facilities for refueling, maintenance, or air traffic control
Heliports: 6,092 (2022)
Pipelines: 1,984,321 km natural gas, 240,711 km petroleum products (2013)
Railways: total: 293,564.2 km (2014)
standard gauge: 293,564.2 km (2014) 1.435-m gauge
comparison ranking: total 1
Roadways: total: 6,586,610 km (2012)
paved: 4,304,715 km (2012) (includes 76,334 km of expressways)
unpaved: 2,281,895 km (2012)
comparison ranking: total 1
Waterways: 41,009 km (2012) (19,312 km used for commerce; Saint Lawrence Seaway of 3,769 km, including the Saint Lawrence River of 3,058 km, is shared with Canada)
comparison ranking: 5
Merchant marine: total: 178 (2022)
by type: bulk carrier 4, container ship 61, general cargo 19, oil tanker 65, other (roll on/roll off 29)
note - oceangoing self-propelled, cargo-carrying vessels of 1,000 gross tons and above
comparison ranking: total 70
Ports and terminals: major seaport(s): Atlantic Ocean: Charleston, Hampton Roads, New York/New Jersey, Savannah
Pacific Ocean: Long Beach, Los Angeles, Oakland, Seattle/Tacoma
Gulf of Mexico: Houston
oil terminal(s): LOOP terminal, Haymark terminal
container port(s) (TEUs): Charleston (2,751,442), Hampton Roads (3,522,834), Houston (3,453,220), Long Beach (9,384,368), Los Angeles (10,677,610), New York/New Jersey (8,985,929), Oakland (2,448,243), Savannah (5,613,163), Seattle/Tacoma (3,736,206) (2021)
LNG terminal(s) (export): Calcasieu Pass (LA), Cameron (LA), Corpus Christi (TX), Cove Point (MD), Elba Island (GA), Freeport (TX), Sabine Pass (LA)
note - two additional export facilities are under construction and expected to begin commercial operations in 2023-2024
LNG terminal(s) (import): Cove Point (MD), Elba Island (GA), Everett (MA), Freeport (TX), Golden Pass (TX), Hackberry (LA), Lake Charles (LA), Neptune (offshore), Northeast Gateway (offshore), Pascagoula (MS), Sabine Pass (TX)
river port(s): Baton Rouge, Plaquemines, New Orleans (Mississippi River)
cargo ports: Baton Rouge, Corpus Christi, Hampton Roads, Houston, Long Beach, Los Angeles, New Orleans, New York, Plaquemines (LA), Tampa, Texas City
cruise departure ports (passengers): Miami, Port Everglades, Port Canaveral, Seattle, Long Beach
Transportation - note: the US operates one PC 1 or 2 class heavy icebreaker, two PC 3 or 4 class medium icebreakers, and two PC 5 or 6 class light icebreakers; the heavy and medium icebreakers carry out various polar missions including opening passage for the annual resupply of McMurdo Station in Antarctica
note - PC indicates a Polar Class vessel: PC 1 - year-round operation in all polar waters (ice thickness >3 m); PC 2 - year-round operation in moderate multi-year ice conditions (ice thickness up to 3 m); PC 3 - year-round operation in second-year ice which may include multi-year ice inclusions (ice thickness up to 2.5 m); PC 4 - year-round operation in thick first-year ice which may include old ice inclusions (ice thickness up to 120 cm); PC 5 - year-round operation in medium first-year ice which may include old ice inclusions (ice thickness up to 70-120 cm); PC 6 - summer/autumn operation in medium first-year ice which may include old ice inclusions (ice thickness up to 30-70 cm)
MILITARY AND SECURITY
Military and security forces: United States Armed Forces (aka US Military): US Army (USA), US Navy (USN; includes US Marine Corps or USMC), US Air Force (USAF), US Space Force (USSF); US Coast Guard (USCG); National Guard (Army National Guard and Air National Guard) (2023)
note 1: the US Coast Guard is administered in peacetime by the Department of Homeland Security, but in wartime reports to the Department of the Navy
note 2: the Army National Guard and the Air National Guard are reserve components of their services and operate in part under state authority; the US military also maintains reserve forces for each branch
note 3: US law enforcement personnel include those of federal agencies, such as the Department of Homeland Security and Department of Justice, the 50 states, special jurisdictions, local sheriff’s offices, and municipal, county, regional, and tribal police departments
note 4: the US has state defense forces (SDFs), which are military units that operate under the sole authority of state governments; SDFs are authorized by state and federal law and are under the command of the governor of each state; as of 2023, more than 20 states and the Commonwealth of Puerto Rico had SDFs, which typically have emergency management and homeland security missions; most are organized as ground units, but air and naval units also exist
Military expenditures: 3.5% of GDP (2023 est.)
3.5% of GDP (2022 est.)
3.5% of GDP (2021)
3.6% of GDP (2020)
3.5% of GDP (2019)
comparison ranking: 21
Military and security service personnel strengths: approximately 1.39 million active-duty personnel (475,000 Army; 345,000 Navy; 335,000 Air Force (includes about 8,000 Space Force); 180,000 Marine Corps; 40,000 Coast Guard); 335,000 Army National Guard; 105,000 Air National Guard (2023)
Military equipment inventories and acquisitions: the US military’s inventory is comprised almost entirely of domestically produced weapons systems (some assembled with foreign components) along with a smaller mix of imported equipment from a variety of Western countries such as Germany and the UK; the US defense industry is capable of designing, developing, maintaining, and producing the full spectrum of weapons systems; the US is the world’s leading arms exporter (2023)
Military service age and obligation: 18 years of age (17 years of age with parental consent) for voluntary service for men and women; no conscription (currently inactive, but males aged 18-25 must register with Selective Service in case conscription is reinstated in the future); maximum enlistment age 34 (Army), 42 (Air Force/Space Force), 39 (Navy), 28 (Marines), 31 (Coast Guard); 8-year service obligation, including 2-5 years active duty (Army), 2 years active duty (Navy), 4 years active duty (Air Force, Coast Guard, Marines, Space Force) (2023)
note 1: the US military has been all-volunteer since 1973, but an act of Congress can reinstate the draft in case of a national emergency
note 2: all military occupations and positions open to women; in 2021, women comprised over 17% of the total US active duty military personnel; a small number of American women were involved in combat during the Revolutionary (1775-1783), Mexican (1846-1848), and Civil (1861-1865) Wars, but they had to disguise themselves as men and enlist under aliases; the first official US military organization for women was the US Army Nurse Corps, established in 1901; during World War I, the US Navy and Marine Corps allowed women to enlist; nearly 350,000 women served in the US military during World War II; the 1991 Gulf War was the first war where women served with men in integrated units within a war zone; in 2015, women were allowed to serve in direct combat roles
note 3: non-citizens living permanently and legally in the US may join as enlisted personnel; must have permission to work in the US, a high school diploma, and speak, read, and write English fluently; minimum age of 17 with parental consent or 18 without; maximum age 29-39, depending on the service; under the US Nationality Act, honorable service in the military may qualify individuals to obtain expedited citizenship; under the Compact of Free Association, citizens of the Federated States of Micronesia, the Republic of Palau, and the Republic of the Marshall Islands may volunteer; under the Jay Treaty, signed in 1794 between Great Britain and the US, and corresponding legislation, Native Americans/First Nations born in Canada are entitled to freely enter the US and join the US military
Military deployments: 5,000 Africa; 1,700 Australia; 250 Diego Garcia; 150 Canada; 650 Cuba (Guantanamo Bay); 290 Egypt (MFO); approximately 85-100,000 Europe; 150 Greenland; 6,200 Guam; 370 Honduras; 55,000 Japan; approximately 15,000 Middle East; 125 Philippines; 28,000 South Korea; 200 Singapore; 100 Thailand (2023)
note: US military rotational policies affect deployment sizes, and the numbers given may fluctuate; the US deploys ground and air units to select countries for 6-12 month rotational assignments on a continuous basis; in South Korea, for example, the US regularly rotates combat brigades (approximately 3,000 personnel) for 9 months at a time; contingencies also affect US troop deployments; in 2019-2020, the US deployed more than 15,000 additional military personnel to the Middle East for an extended period of time and has sent more than 30,000 reinforcements to Europe in response to the full-scale Russian invasion of Ukraine in 2022; in addition, some overseas US naval bases, such as the headquarters of US Naval Forces Central Command (USNAVCENT) in Manama, Bahrain, are frequented by the crews of US ships on 6-9 month deployments; a US carrier strike group with an air wing and supporting ships typically includes over 6,000 personnel
Military - note: the US is a member of NATO and was one of the original 12 countries to sign the North Atlantic Treaty (also known as the Washington Treaty) in 1949
the US military has 11 regional- or functionally based joint service “combatant” commands: Africa Command; Central Command, Cyber Command, European Command, Indo-Pacific Command, Northern Command, Southern Command, Space Command, Special Operations Command, Strategic Command, and Transportation Command
Congress officially created the US military in September 1789; the US Army was established in June 1775 as the Continental Army; after the declaration of independence in July 1776, the Continental Army and the militia in the service of Congress became known collectively as the Army of the United States; when Congress ordered the Continental Army to disband in 1784, it retained a small number of personnel that would form the nucleus of the 1st American Regiment for national service formed later that year; both the US Navy and the US Marines were also established in 1775, but the Navy fell into disuse after the Revolutionary War, and was reestablished by Congress in 1794; the first US military unit devoted exclusively to aviation began operations in 1913 as part of the US Army; the Army Air Corps (AAC) was the US military service dedicated to aerial warfare between 1926 and 1941; the AAC became the US Army Air Forces in 1941 and remained as a combat arm of the Army until the establishment of the US Air Force in 1947
SPACE
Space agency/agencies: National Aeronautics and Space Administration (NASA; established 1958); National Reconnaissance Office (NRO; established in 1961 and responsible for designing, building, launching, and maintaining intelligence satellites); US Space Command (USSPACECOM; originally created in 1985 but was deactivated in 2002 and its duties were transferred to US Strategic Command; re-established 2019 and responsible for military operations in outer space, specifically all operations over 100 kilometers or 62 miles above mean sea level); USSPACECOM has two field commands: Combined Force Space Component Command and the Joint Task Force Space Defense; the US Space Force (established 2019) is a military branch with three major commands: Space Operations Command (responsible for training and preparing forces to support USSPACECOM), Space Systems Command (oversees the military’s development of next-generation technologies, the procurement of satellites, and launch services), and Space Training and Readiness Command (training and education); it also includes the Space Development Agency (SDA; established 2019 to help integrate emerging technologies into US military space programs) (2023)
Space launch site(s): has nearly 20 commercial, government, and private space ports hosting Federal Aviation Administration-licensed activity spread across 10 states (Alabama, Alaska, California, Colorado, Florida, Georgia, New Mexico, Oklahoma, Texas, and Virginia) (2023)
Space program overview: has a large and comprehensive space program and is one of the world’s top space powers; builds, launches, and operates space launch vehicles (SLVs)/rockets and the full spectrum of spacecraft, including interplanetary probes, manned craft, reusable rockets, satellites, space stations, and space planes; has an astronaut program and a large corps of astronauts; researching and developing a broad range of other space-related capabilities and technologies, such as advanced telecommunications and optics, navigational aids, propulsion, robotics, solar sails, space-based manufacturing, and robotic satellite repair/refueling; has launched orbital or lander probes to the Sun and all planets in the solar system, as well as to asteroids and beyond the solar system; has international missions and projects with dozens of countries and organizations, including such major partners as Canada, Japan, Russia, and South Korea, as well as the European Space Agency (ESA), the EU, and their individual member states; most recently, over 30 countries have signed onto the US Artemis Accords (as of late 2023), whose purpose is to establish principles, guidelines, and best practices to enhance the governance of the civil exploration and use of outer space with the intention of advancing the Artemis Program, an international effort to establish a sustainable and robust presence on the Moon and an onward human mission to Mars; the US commercial space industry is one of the world’s largest and most capable and is active across the entire spectrum of US government space programs; the majority of both NASA and US military space launches are conducted by US commercial companies; the US space economy was valued at over $200 billion in 2021 (2023)
note: further details about the key activities, programs, and milestones of the country’s space program, as well as government spending estimates on the space sector, appear in Appendix S
TERRORISM
Terrorist group(s): Terrorist group(s): Hizballah; Islamic Revolutionary Guard Corps (IRGC)/Qods Force; Islamic State of Iraq and ash-Sham (ISIS); al-Qa’ida; Lashkar-e Tayyiba (LeT)
note: details about the history, aims, leadership, organization, areas of operation, tactics, targets, weapons, size, and sources of support of the group(s) appear(s) in Appendix-T
TRANSNATIONAL ISSUES
Disputes - international: US-Antarctica: the US has made no territorial claim in Antarctica (but has reserved the right to do so) and does not recognize the claims of any other states
US-Bahamas: the Bahamas and US have not been able to agree on a maritime boundary; the two countries have met several times to define their maritime boundary
US-Canada: Canada and the United States dispute how to divide the Beaufort Sea and the status of the Northwest Passage but continue to work cooperatively to survey the Arctic continental shelf; because of the dispute over Machias Seal Island and adjoining North Rock, the terminus of the land boundary beyond Canada’s Grand Manon Island and the US state of Maine is not defined
US-Canada-Mexico: the US has intensified domestic security measures and is collaborating closely with its neighbors, Canada and Mexico, to monitor and control legal and illegal personnel, transport, and commodities across the international borders
US-Cuba: the US Naval Base at Guantanamo Bay is leased from Cuba and only mutual agreement or US abandonment of the area can terminate the lease
US-Haiti: Haiti claims US-administered Navassa Island; the dispute dates to 1857, when the US claimed the Navassa Island under the 1856 Guano Act; Haiti claims it has had ownership over Navassa Island continuously since its 1801 constitution laid claim to “adjacent lands”
US-Marshall Islands: in May 2016, the Marshall Islands filed a declaration of authority with the UN over Wake Island, which is currently a US territory, reaffirming that it considers Wake Island part of its territory; control over Wake Island would drastically increase the Marshall Islands’ exclusive economic zone; the US State Department is assembling a group of experts from both countries to discuss the maritime boundary
US-Russia: 1990 Maritime Boundary Agreement in the Bering Sea still awaits Russian Duma ratification
US-Tokelau: Tokelau included American Samoa’s Swains Island among the islands listed in its 2006 draft constitution; Swains Island has been administered by American Samoa since 1925; the 1980 Treaty of Tokehega delineates the maritime boundary between American Samoa and Tokelau; while not specifically mentioning Swains Island, the treaty notes in its preamble that New Zealand does not claim as part of Tokelau any island administered as part of American Samoa
Refugees and internally displaced persons: refugees (country of origin): the US admitted 25,465 refugees during FY2022, including: 7,810 (Democratic Republic of the Congo), 4,556 (Syria), 2,156 (Burma), 1,669 (Sudan), 1,618 (Afghanistan), 1,610 (Ukraine)
stateless persons: 47 (2022)
Illicit drugs: world’s largest consumer of cocaine (shipped from Colombia through Mexico and the Caribbean), Colombian heroin, and Mexican heroin and marijuana; major consumer of ecstasy and Mexican methamphetamine; minor consumer of high-quality Southeast Asian heroin; illicit producer of cannabis, marijuana, depressants, stimulants, hallucinogens, and methamphetamine; money-laundering center
UNITED STATES PACIFIC ISLAND WILDLIFE REFUGES
INTRODUCTION
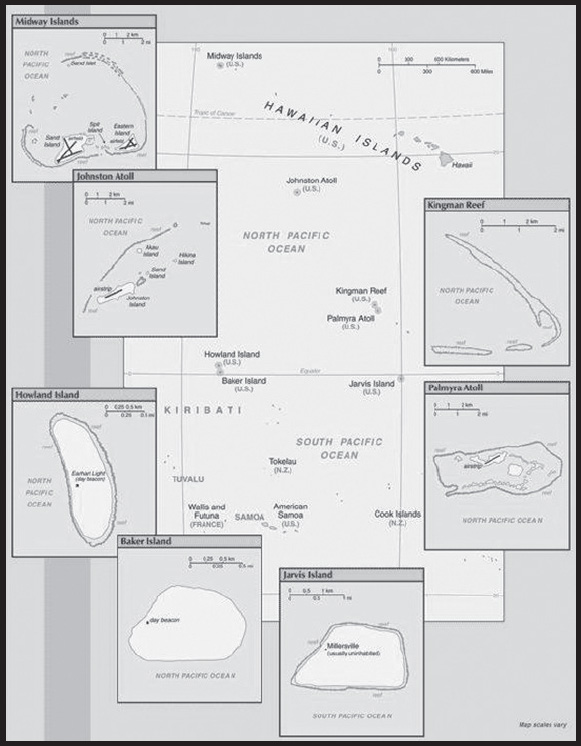
Background: All of the following US Pacific island territories except Midway Atoll constitute the Pacific Remote Islands National Wildlife Refuge (NWR) Complex and as such are managed by the Fish and Wildlife Service of the US Department of the Interior. Midway Atoll NWR has been included in a Refuge Complex with the Hawaiian Islands NWR and also designated as part of Papahanaumokuakea Marine National Monument. These remote refuges are the most widespread collection of marine- and terrestrial-life protected areas on the planet under a single country’s jurisdiction. They sustain many endemic species including corals, fish, shellfish, marine mammals, seabirds, water birds, land birds, insects, and vegetation not found elsewhere.
Baker Island: The US took possession of the island in 1857. Its guano deposits were mined by US and British companies during the second half of the 19th century. In 1935, a short-lived attempt at colonization began on this island but was disrupted by World War II and thereafter abandoned. The island was established as a NWR in 1974.
Howland Island: Discovered by the US early in the 19th century, the uninhabited atoll was officially claimed by the US in 1857. Both US and British companies mined for guano deposits until about 1890. In 1935, a short-lived attempt at colonization began on this island, similar to the effort on nearby Baker Island, but was disrupted by World War II and thereafter abandoned. The famed American aviatrix Amelia EARHART disappeared while seeking out Howland Island as a refueling stop during her 1937 round-the-world flight; Earhart Light, a day beacon near the middle of the west coast, was named in her memory. The island was established as a NWR in 1974.
Jarvis Island: First discovered by the British in 1821, the uninhabited island was annexed by the US in 1858 but abandoned in 1879 after tons of guano had been removed. The UK annexed the island in 1889 but never carried out plans for further exploitation. The US occupied and reclaimed the island in 1935. It was abandoned in 1942 during World War II. The island was established as a NWR in 1974.
Johnston Atoll: Both the US and the Kingdom of Hawaii annexed Johnston Atoll in 1858, but it was the US that mined the guano deposits until the late 1880s. Johnston and Sand Islands were designated wildlife refuges in 1926. The US Navy took over the atoll in 1934. Subsequently, the US Air Force assumed control in 1948. The site was used for high-altitude nuclear tests in the 1950s and 1960s. Until late in 2000 the atoll was maintained as a storage and disposal site for chemical weapons. Munitions destruction, cleanup, and closure of the facility were completed by May 2005. The Fish and Wildlife Service and the US Air Force are currently discussing future management options; in the interim, Johnston Atoll and the three-mile Naval Defensive Sea around it remain under the jurisdiction and administrative control of the US Air Force.
Kingman Reef: The US annexed the reef in 1922. Its sheltered lagoon served as a way station for flying boats on Hawaii-to-American Samoa flights during the late 1930s. There are no terrestrial plants on the reef, which is frequently awash, but it does support abundant and diverse marine fauna and flora. In 2001, the waters surrounding the reef out to 12 nm were designated a NWR.
Midway Islands: The US took formal possession of the islands in 1867. The laying of the transpacific cable, which passed through the islands, brought the first residents in 1903. Between 1935 and 1947, Midway was used as a refueling stop for transpacific flights. The US naval victory over a Japanese fleet off Midway in 1942 was one of the turning points of World War II. The islands continued to serve as a naval station until closed in 1993. Today the islands are a NWR and are the site of the world’s largest Laysan albatross colony.
Palmyra Atoll: The Kingdom of Hawaii claimed the atoll in 1862, and the US included it among the Hawaiian Islands when it annexed the archipelago in 1898. The Hawaii Statehood Act of 1959 did not include Palmyra Atoll, which is now partly privately owned by the Nature Conservancy with the rest owned by the Federal government and managed by the US Fish and Wildlife Service. These organizations are managing the atoll as a wildlife refuge. The lagoons and surrounding waters within the 12-nm US territorial seas were transferred to the US Fish and Wildlife Service and designated a NWR in January 2001.
GEOGRAPHY
Location: Oceania
Baker Island: atoll in the North Pacific Ocean 3,390 km southwest of Honolulu, about halfway between Hawaii and Australia;
Howland Island: island in the North Pacific Ocean 3,360 km southwest of Honolulu, about halfway between Hawaii and Australia;
Jarvis Island: island in the South Pacific Ocean 2,415 km south of Honolulu, about halfway between Hawaii and Cook Islands;
Johnston Atoll: atoll in the North Pacific Ocean 1,330 km southwest of Honolulu, about one-third of the way from Hawaii to the Marshall Islands;
Kingman Reef: reef in the North Pacific Ocean 1,720 km south of Honolulu, about halfway between Hawaii and American Samoa;
Midway Islands: atoll in the North Pacific Ocean 2,335 km northwest of Honolulu near the end of the Hawaiian Archipelago, about one-third of the way from Honolulu to Tokyo;
Palmyra Atoll: atoll in the North Pacific Ocean 1,780 km south of Honolulu, about halfway between Hawaii and American Samoa
Geographic coordinates:
Baker Island: 0 13 N, 176 28 W;
Howland Island: 0 48 N, 176 38 W;
Jarvis Island: 0 23 S, 160 01 W;
Johnston Atoll: 16 45 N, 169 31 W;
Kingman Reef: 6 23 N, 162 25 W;
Midway Islands: 28 12 N, 177 22 W;
Palmyra Atoll: 5 53 N, 162 05 W
Map references: Oceania
Area: land: 6,959.41 sq km (emergent land - 22.41 sq km; submerged - 6,937 sq km)
Baker Island: total - 129.1 sq km; emergent land - 2.1 sq km; submerged - 127 sq km
Howland Island: total - 138.6 sq km; emergent land - 2.6 sq km; submerged - 136 sq km
Jarvis Island: total - 152 sq km; emergent land - 5 sq km; submerged - 147 sq km
Johnston Atoll: total - 276.6 sq km; emergent land - 2.6 sq km; submerged - 274 sq km
Kingman Reef: total - 1,958.01 sq km; emergent land - 0.01 sq km; submerged - 1,958 sq km
Midway Islands: total - 2,355.2 sq km; emergent land - 6.2 sq km; submerged - 2,349 sq km
Palmyra Atoll: total - 1,949.9 sq km; emergent land - 3.9 sq km; submerged - 1,946 sq km
Area - comparative: Baker Island: about 2.5 times the size of the National Mall in Washington, DC;
Howland Island: about three times the size of the National Mall in Washington, DC;
Jarvis Island: about eight times the size of the National Mall in Washington, DC;
Johnston Atoll: about 4.5 times the size of the National Mall in Washington, DC;
Kingman Reef: a little more than 1.5 times the size of the National Mall in Washington, DC;
Midway Islands: about nine times the size of the National Mall in Washington, DC;
Palmyra Atoll: about 20 times the size of the National Mall in Washington, DC
Land boundaries: total: 0 km
Coastline: Baker Island: 4.8 km
Howland Island: 6.4 km
Jarvis Island: 8 km
Johnston Atoll: 34 km
Kingman Reef: 3 km
Midway Islands: 15 km
Palmyra Atoll: 14.5 km
Maritime claims: territorial sea: 12 nm
exclusive economic zone: 200 nm
Climate: Baker, Howland, and Jarvis Islands: equatorial; scant rainfall, constant wind, burning sun;
Johnston Atoll and Kingman Reef: tropical, but generally dry; consistent northeast trade winds with little seasonal temperature variation;
Midway Islands: subtropical with cool, moist winters (December to February) and warm, dry summers (May to October); moderated by prevailing easterly winds; most of the 107 cm of annual rainfall occurs during the winter;
Palmyra Atoll: equatorial, hot; located within the low pressure area of the Intertropical Convergence Zone (ITCZ) where the northeast and southeast trade winds meet, it is extremely wet with between 400-500 cm of rainfall each year
Terrain: low and nearly flat sandy coral islands with narrow fringing reefs that have developed at the top of submerged volcanic mountains, which in most cases rise steeply from the ocean floor
Elevation: highest point: Baker Island, unnamed location 8 m; Howland Island, unnamed location 3 m; Jarvis Island, unnamed location 7 m; Johnston Atoll, Sand Island 10 m; Kingman Reef, unnamed location 2 m; Midway Islands, unnamed location less than 13 m; Palmyra Atoll, unnamed location 3 m
lowest point: Pacific Ocean 0 m
Natural resources: terrestrial and aquatic wildlife
Land use: other: 100% (2018 est.)
Natural hazards: Baker, Howland, and Jarvis Islands: the narrow fringing reef surrounding the island poses a maritime hazard;
Kingman Reef: wet or awash most of the time, maximum elevation of less than 2 m makes Kingman Reef a maritime hazard;
Midway Islands, Johnston, and Palmyra Atolls: NA
Geography - note: Baker, Howland, and Jarvis Islands: scattered vegetation consisting of grasses, prostrate vines, and low growing shrubs; primarily a nesting, roosting, and foraging habitat for seabirds, shorebirds, and marine wildlife; closed to the public;
Johnston Atoll: Johnston Island and Sand Island are natural islands, which have been expanded by coral dredging; North Island (Akau) and East Island (Hikina) are manmade islands formed from coral dredging; the egg-shaped reef is 34 km in circumference; closed to the public;
Kingman Reef: barren coral atoll with deep interior lagoon; closed to the public;
Midway Islands: a coral atoll managed as a National Wildlife Refuge and open to the public for wildlife-related recreation in the form of wildlife observation and photography;
Palmyra Atoll: the high rainfall and resulting lush vegetation make the environment of this atoll unique among the US Pacific Island territories; supports a large undisturbed stand of Pisonia beach forest
PEOPLE AND SOCIETY
Population: no indigenous inhabitants
note: public entry is only by special-use permit from US Fish and Wildlife Service and generally restricted to scientists and educators; visited annually by US Fish and Wildlife Service
Jarvis Island: Millersville settlement on western side of island occasionally used as a weather station from 1935 until World War II, when it was abandoned; reoccupied in 1957 during the International Geophysical Year by scientists who left in 1958; currently unoccupied
Johnston Atoll: in previous years, an average of 1,100 US military and civilian contractor personnel were present; as of May 2005, all US Government personnel had left the island
Midway Islands: approximately 40 people make up the staff of US Fish and Wildlife Service and their services contractor living at the atoll
Palmyra Atoll: four to 20 Nature Conservancy, US Fish and Wildlife staff, and researchers
ENVIRONMENT
Environment - current issues:
Baker Island: no natural freshwater resources; feral cats, introduced in 1937 during a short-lived colonization effort, ravaged the avian population and were eradicated in 1965
Howland Island: no natural freshwater resources; the island habitat has suffered from invasive exotic species; black rats, introduced in 1854, were eradicated by feral cats within a year of their introduction in 1937; the cats preyed on the bird population and were eliminated by 1985
Jarvis Island: no natural freshwater resources; feral cats, introduced in the 1930s during a short-lived colonization venture, were not completely removed until 1990
Johnston Atoll: no natural freshwater resources; the seven decades under US military administration (1934-2004) left the atoll environmentally degraded and required large-scale remediation efforts; a swarm of Anoplolepis (crazy) ants invaded the island in 2010 damaging native wildlife; eradication has been largely, but not completely, successful
Midway Islands: many exotic species introduced, 75% of the roughly 200 plant species on the island are non-native; plastic pollution harms wildlife, via entanglement, ingestion, and toxic contamination
Kingman Reef: none
Palmyra Atoll: black rats, believed to have been introduced to the atoll during the US military occupation of the 1940s, severely degraded the ecosystem outcompeting native species (seabirds, crabs); following a successful rat removal project in 2011, native flora and fauna have begun to recover
Climate: Baker, Howland, and Jarvis Islands: equatorial; scant rainfall, constant wind, burning sun;
Johnston Atoll and Kingman Reef: tropical, but generally dry; consistent northeast trade winds with little seasonal temperature variation;
Midway Islands: subtropical with cool, moist winters (December to February) and warm, dry summers (May to October); moderated by prevailing easterly winds; most of the 107 cm of annual rainfall occurs during the winter;
Palmyra Atoll: equatorial, hot; located within the low pressure area of the Intertropical Convergence Zone (ITCZ) where the northeast and southeast trade winds meet, it is extremely wet with between 400-500 cm of rainfall each year
Land use: other: 100% (2018 est.)
GOVERNMENT
Country name: conventional long form: none
conventional short form: Baker Island, Howland Island, Jarvis Island, Johnston Atoll, Kingman Reef, Midway Islands, Palmyra Atoll
etymology: self-descriptive name specifying the territories’ affiliation and location
Dependency status: with the exception of Palmyra Atoll, the constituent islands are unincorporated, unorganized territories of the US; administered from Washington, DC, by the Fish and Wildlife Service of the US Department of the Interior as part of the National Wildlife Refuge System
note: Palmyra Atoll is partly privately owned and partly federally owned; the federally owned portion is administered from Washington, DC, by the Fish and Wildlife Service of the US Department of the Interior as an incorporated, unorganized territory of the US; the Office of Insular Affairs of the US Department of the Interior continues to administer nine excluded areas comprising certain tidal and submerged lands within the 12 nm territorial sea or within the lagoon
Legal system: the laws of the US apply where applicable
Diplomatic representation from the US: none (territories of the US)
Flag description: the flag of the US is used
TRANSPORTATION
Airports: Midway Islands: (2013) 3 - one operational (2,377 m paved); no fuel for sale except emergencies
Airports - with paved runways: note - abandoned but usable
Ports and terminals: major seaport(s): Baker, Howland, and Jarvis Islands, and Kingman Reef
MILITARY AND SECURITY
Military - note: defense is the responsibility of the US
TRANSNATIONAL ISSUES
Disputes - international: none identified
URUGUAY
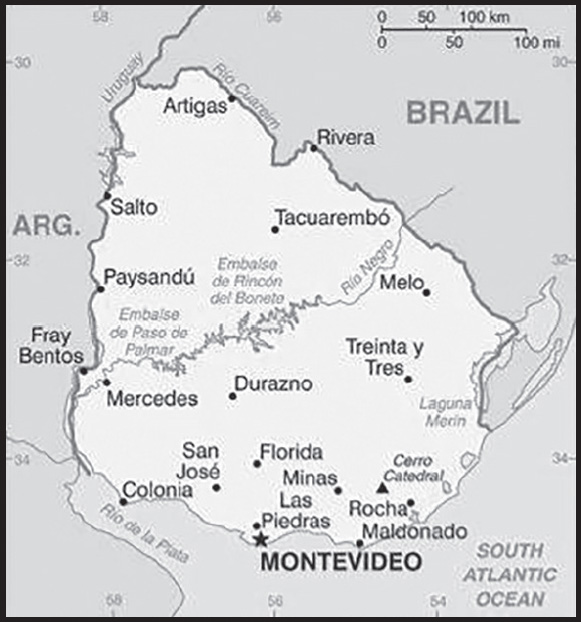
INTRODUCTION
Background: Montevideo, founded by the Spanish in 1726 as a military stronghold, soon became an important commercial center due to its natural harbor. Claimed by Argentina but annexed by Brazil in 1821, Uruguay declared its independence in 1825 and secured its freedom in 1828 after a three-year struggle. The administrations of President Jose BATLLE in the early 20th century launched widespread political, social, and economic reforms that established a statist tradition. A violent Marxist urban guerrilla movement named the Tupamaros (or Movimiento de Liberación Nacional-Tupamaros (MLN-T)), launched in the late 1960s, led Uruguay’s president to cede control of the government to the military in 1973. By yearend, the rebels had been crushed, but the military continued to expand its hold over the government. Civilian rule was restored in 1985. In 2004, the left-of-center Frente Amplio (FA) Coalition won national elections that effectively ended 170 years of political control previously held by the Colorado and National (Blanco) parties. The left-of-center retained the presidency and control of both chambers of congress until 2019. Uruguay’s political and labor conditions are among the freest on the continent.
GEOGRAPHY
Location: Southern South America, bordering the South Atlantic Ocean, between Argentina and Brazil
Geographic coordinates: 33 00 S, 56 00 W
Map references: South America
Area: total: 176,215 sq km
land: 175,015 sq km
water: 1,200 sq km
comparison ranking: total 91
Area - comparative: about the size of Virginia and West Virginia combined; slightly smaller than the state of Washington
Land boundaries: total: 1,591 km
border countries (2): Argentina 541 km; Brazil 1,050 km
Coastline: 660 km
Maritime claims: territorial sea: 12 nm
contiguous zone: 24 nm
exclusive economic zone: 200 nm
continental shelf: 200 nm or the edge of continental margin
Climate: warm temperate; freezing temperatures almost unknown
Terrain: mostly rolling plains and low hills; fertile coastal lowland
Elevation: highest point: Cerro Catedral 514 m
lowest point: Atlantic Ocean 0 m
mean elevation: 109 m
Natural resources: arable land, hydropower, minor minerals, fish
Land use: agricultural land: 87.2% (2018 est.)
arable land: 10.1% (2018 est.)
permanent crops: 0.2% (2018 est.)
permanent pasture: 76.9% (2018 est.)
forest: 10.2% (2018 est.)
other: 2.6% (2018 est.)
Irrigated land: 2,380 sq km (2012)
Major lakes (area sq km): salt water lake(s): Lagoa Mirim (shared with Brazil) - 2,970 sq km
Major rivers (by length in km): Rio de la Plata/Parana river mouth (shared with Brazil [s], Argentina, Paraguay) - 4,880 km; Uruguay river mouth (shared with Brazil [s] and Argentina) - 1,610 km
note – [s] after country name indicates river source; [m] after country name indicates river mouth
Major aquifers: Guarani Aquifer System
Population distribution: most of the country’s population resides in the southern half of the country; approximately 80% of the populace is urban, living in towns or cities; nearly half of the population lives in and around the capital of Montevideo
Natural hazards: seasonally high winds (the pampero is a chilly and occasional violent wind that blows north from the Argentine pampas), droughts, floods; because of the absence of mountains, which act as weather barriers, all locations are particularly vulnerable to rapid changes from weather fronts
Geography - note: second-smallest South American country (after Suriname); most of the low-lying landscape (three-quarters of the country) is grassland, ideal for cattle and sheep raising
PEOPLE AND SOCIETY
Population: 3,416,264 (2023 est.)
comparison ranking: 132
Nationality: noun: Uruguayan(s)
adjective: Uruguayan
Ethnic groups: White 87.7%, Black 4.6%, Indigenous 2.4%, other 0.3%, none or unspecified 5% (2011 est.)
note: data represent primary ethnic identity
Languages: Spanish (official) (many speak the Rioplatense dialect)
major-language sample(s):
La Libreta Informativa del Mundo, la fuente indispensable de información básica. (Spanish)
Religions: Roman Catholic 42%, Protestant 15%, other 6%, agnostic 3%, atheist 10%, unspecified 24% (2014 est.)
Demographic profile: Uruguay rates high for most development indicators and is known for its secularism, liberal social laws, and well-developed social security, health, and educational systems. It is one of the few countries in Latin America and the Caribbean where the entire population has access to clean water. Uruguay’s provision of free primary through university education has contributed to the country’s high levels of literacy and educational attainment. However, the emigration of human capital has diminished the state’s return on its investment in education. Remittances from the roughly 18% of Uruguayans abroad amount to less than 1 percent of national GDP. The emigration of young adults and a low birth rate are causing Uruguay’s population to age rapidly.
In the 1960s, Uruguayans for the first time emigrated en masse - primarily to Argentina and Brazil - because of economic decline and the onset of more than a decade of military dictatorship. Economic crises in the early 1980s and 2002 also triggered waves of emigration, but since 2002 more than 70% of Uruguayan emigrants have selected the US and Spain as destinations because of better job prospects. Uruguay had a tiny population upon its independence in 1828 and welcomed thousands of predominantly Italian and Spanish immigrants, but the country has not experienced large influxes of new arrivals since the aftermath of World War II. More recent immigrants include Peruvians and Arabs.
Age structure: 0-14 years: 19.02% (male 330,536/female 319,132)
15-64 years: 65.55% (male 1,110,881/female 1,128,546)
65 years and over: 15.43% (2023 est.) (male 213,750/female 313,419)
Dependency ratios: total dependency ratio: 53.6
youth dependency ratio: 29.9
elderly dependency ratio: 23.7
potential support ratio: 4.2 (2021 est.)
Median age: total: 36.2 years (2023 est.)
male: 34.6 years
female: 37.9 years
comparison ranking: total 87
Population growth rate: 0.27% (2023 est.)
comparison ranking: 170
Birth rate: 12.7 births/1,000 population (2023 est.)
comparison ranking: 138
Death rate: 9.1 deaths/1,000 population (2023 est.)
comparison ranking: 57
Net migration rate: -0.9 migrant(s)/1,000 population (2023 est.)
comparison ranking: 140
Population distribution: most of the country’s population resides in the southern half of the country; approximately 80% of the populace is urban, living in towns or cities; nearly half of the population lives in and around the capital of Montevideo
Urbanization: urban population: 95.8% of total population (2023)
rate of urbanization: 0.4% annual rate of change (2020-25 est.)
Major urban areas - population: 1.774 million MONTEVIDEO (capital) (2023)
Sex ratio: at birth: 1.04 male(s)/female
0-14 years: 1.04 male(s)/female
15-64 years: 0.98 male(s)/female
65 years and over: 0.68 male(s)/female
total population: 0.94 male(s)/female (2023 est.)
Maternal mortality ratio: 19 deaths/100,000 live births (2020 est.)
comparison ranking: 127
Infant mortality rate: total: 8.1 deaths/1,000 live births (2023 est.)
male: 9.3 deaths/1,000 live births
female: 7 deaths/1,000 live births
comparison ranking: total 146
Life expectancy at birth: total population: 78.7 years (2023 est.)
male: 75.6 years
female: 81.9 years
comparison ranking: total population 69
Total fertility rate: 1.75 children born/woman (2023 est.)
comparison ranking: 149
Gross reproduction rate: 0.86 (2023 est.)
Contraceptive prevalence rate: 79.6% (2015)
note: percent of women aged 15-44
Drinking water source: improved: total: 100% of population
unimproved: total: 0% of population (2020 est.)
Current health expenditure: 9.2% of GDP (2020)
Physicians density: 4.94 physicians/1,000 population (2017)
Hospital bed density: 2.4 beds/1,000 population (2017)
Sanitation facility access: improved: urban: 99.2% of population
rural: 99.6% of population
total: 99.2% of population
unimproved: urban: 0.8% of population
rural: 0.4% of population
total: 0.8% of population (2020 est.)
Obesity - adult prevalence rate: 27.9% (2016)
comparison ranking: 33
Alcohol consumption per capita: total: 5.42 liters of pure alcohol (2019 est.)
beer: 1.86 liters of pure alcohol (2019 est.)
wine: 2.86 liters of pure alcohol (2019 est.)
spirits: 0.71 liters of pure alcohol (2019 est.)
other alcohols: 0 liters of pure alcohol (2019 est.)
comparison ranking: total 82
Tobacco use: total: 21.5% (2020 est.)
male: 24.4% (2020 est.)
female: 18.5% (2020 est.)
comparison ranking: total 76
Children under the age of 5 years underweight: 1.8% (2018)
comparison ranking: 109
Currently married women (ages 15-49): 55.4% (2023 est.)
Education expenditures: 4.6% of GDP (2020 est.)
comparison ranking: 91
Literacy: definition: age 15 and over can read and write
total population: 98.8%
male: 98.5%
female: 99% (2019)
School life expectancy (primary to tertiary education): total: 19 years
male: 17 years
female: 20 years (2019)
Youth unemployment rate (ages 15-24): total: 32.9% (2021 est.)
male: 28.3%
female: 38.7%
comparison ranking: total 29
ENVIRONMENT
Environment - current issues: water pollution from meat packing, tannery industries; heavy metal pollution; inadequate solid and hazardous waste disposal; deforestation
Environment - international agreements: party to: Antarctic-Environmental Protection, Antarctic-Marine Living Resources, Antarctic Treaty, Biodiversity, Climate Change, Climate Change-Kyoto Protocol, Climate Change-Paris Agreement, Comprehensive Nuclear Test Ban, Desertification, Endangered Species, Environmental Modification, Hazardous Wastes, Law of the Sea, Marine Dumping-London Protocol, Nuclear Test Ban, Ozone Layer Protection, Ship Pollution, Wetlands, Whaling
signed, but not ratified: Marine Dumping-London Convention, Marine Life Conservation
Climate: warm temperate; freezing temperatures almost unknown
Land use: agricultural land: 87.2% (2018 est.)
arable land: 10.1% (2018 est.)
permanent crops: 0.2% (2018 est.)
permanent pasture: 76.9% (2018 est.)
forest: 10.2% (2018 est.)
other: 2.6% (2018 est.)
Urbanization: urban population: 95.8% of total population (2023)
rate of urbanization: 0.4% annual rate of change (2020-25 est.)
Revenue from forest resources: 1.56% of GDP (2018 est.)
comparison ranking: 41
Revenue from coal: 0% of GDP (2018 est.)
comparison ranking: 104
Air pollutants: particulate matter emissions: 8.48 micrograms per cubic meter (2019 est.)
carbon dioxide emissions: 6.77 megatons (2016 est.)
methane emissions: 25.59 megatons (2020 est.)
Waste and recycling: municipal solid waste generated annually: 1,260,140 tons (2012 est.)
municipal solid waste recycled annually: 100,811 tons (2011 est.)
percent of municipal solid waste recycled: 8% (2011 est.)
Major lakes (area sq km): salt water lake(s): Lagoa Mirim (shared with Brazil) - 2,970 sq km
Major rivers (by length in km): Rio de la Plata/Parana river mouth (shared with Brazil [s], Argentina, Paraguay) - 4,880 km; Uruguay river mouth (shared with Brazil [s] and Argentina) - 1,610 km
note – [s] after country name indicates river source; [m] after country name indicates river mouth
Major aquifers: Guarani Aquifer System
Total water withdrawal: municipal: 410 million cubic meters (2020 est.)
industrial: 80 million cubic meters (2020 est.)
agricultural: 3.17 billion cubic meters (2020 est.)
Total renewable water resources: 172.2 billion cubic meters (2020 est.)
GOVERNMENT
Country name: conventional long form: Oriental Republic of Uruguay
conventional short form: Uruguay
local long form: República Oriental del Uruguay
local short form: Uruguay
former: Banda Oriental, Cisplatine Province
etymology: name derives from the Spanish pronunciation of the Guarani Indian designation of the Uruguay River, which makes up the western border of the country and whose name later came to be applied to the entire country
Government type: presidential republic
Capital: name: Montevideo
geographic coordinates: 34 51 S, 56 10 W
time difference: UTC-3 (2 hours ahead of Washington, DC, during Standard Time)
etymology: the name “Montevidi” was originally applied to the hill that overlooked the bay upon which the city of Montevideo was founded; the earliest meaning may have been “[the place where we] saw the hill”
Administrative divisions: 19 departments (departamentos, singular - departamento); Artigas, Canelones, Cerro Largo, Colonia, Durazno, Flores, Florida, Lavalleja, Maldonado, Montevideo, Paysandu, Rio Negro, Rivera, Rocha, Salto, San Jose, Soriano, Tacuarembo, Treinta y Tres
Independence: 25 August 1825 (from Brazil)
National holiday: Independence Day, 25 August (1825)
Constitution: history: several previous; latest approved by plebiscite 27 November 1966, effective 15 February 1967, reinstated in 1985 at the conclusion of military rule
amendments: initiated by public petition of at least 10% of qualified voters, proposed by agreement of at least two fifths of the General Assembly membership, or by existing “constitutional laws” sanctioned by at least two thirds of the membership in both houses of the Assembly; proposals can also be submitted by senators, representatives, or by the executive power and require the formation of and approval in a national constituent convention; final passage by either method requires approval by absolute majority of votes cast in a referendum; amended many times, last in 2004
Legal system: civil law system based on the Spanish civil code
International law organization participation: accepts compulsory ICJ jurisdiction; accepts ICCt jurisdiction
Citizenship: citizenship by birth: yes
citizenship by descent only: yes
dual citizenship recognized: yes
residency requirement for naturalization: 3-5 years
Suffrage: 18 years of age; universal and compulsory
Executive branch: chief of state: President Luis Alberto LACALLE POU (since 1 March 2020); Vice President Beatriz ARGIMON Cedeira (since 1 March 2020); the president is both chief of state and head of government
head of government: President Luis Alberto LACALLE POU (since 1 March 2020); Vice President Beatriz ARGIMON Cedeira (since 1 March 2020)
cabinet: Council of Ministers appointed by the president with approval of the General Assembly
elections/appointments: president and vice president directly elected on the same ballot by absolute majority vote in 2 rounds if needed for a 5-year term (eligible for nonconsecutive terms); election last held on 27 October 2019 with a runoff election on 24 November 2019 (next to be held in October 2024, and a runoff if needed in November 2024)
election results: 2019: Luis Alberto LACALLE POU elected president in second round; percent of vote in first round - Daniel MARTINEZ (FA) 40.7%, Luis Alberto LACALLE POU (Blanco) 29.7%, Ernesto TALVI (Colorado Party) 12.8%, Guido MANINI RIOS (Open Cabildo) 11.3%, other 5.5%; percent of vote in second round - Luis Alberto LACALLE POU 50.6%, Daniel MARTINEZ 49.4%
2014: Tabare VAZQUEZ elected president in second round; percent of vote - Tabare VAZQUEZ (Socialist Party) 56.5%, Luis Alberto LACALLE Pou (Blanco) 43.4%
Legislative branch: description: bicameral General Assembly or Asamblea General consists of:
Chamber of Senators or Camara de Senadores (30 seats; members directly elected in a single nationwide constituency by proportional representation vote; the vice-president serves as the presiding ex-officio member; elected members serve 5-year terms)
Chamber of Representatives or Camara de Representantes (99 seats; members directly elected in multi-seat constituencies by party-list proportional representation vote using the D’Hondt method; members serve 5-year terms)
elections: Chamber of Senators - last held on 27 October 2019 (next to be held in October 2024)
Chamber of Representatives - last held on 27 October 2019 (next to be held in October 2024)
election results: Chamber of Senators - percent of vote by coalition/party - NA; seats by coalition/party - Frente Amplio 13, National Party 10, Colorado Party 4, Open Cabildo 3; composition - men 21, women 10, percent of women 25.3%%
Chamber of Representatives - percent of vote by coalition/party - NA; seats by coalition/party - Frente Amplio 42, National Party 30, Colorado Party 13, Open Cabildo 11, Independent Party 1, other 2; composition - men 74, women 25, percent of women 25.3%; note - total General Assembly percent of women 26.9%
Judicial branch: highest court(s): Supreme Court of Justice (consists of 5 judges)
judge selection and term of office: judges nominated by the president and appointed by two-thirds vote in joint conference of the General Assembly; judges serve 10-year terms, with reelection possible after a lapse of 5 years following the previous term
subordinate courts: Courts of Appeal; District Courts (Juzgados Letrados); Peace Courts (Juzgados de Paz); Rural Courts (Juzgados Rurales)
Political parties and leaders: Broad Front or FA (Frente Amplio) [Fernando PEREIRA] - (a broad governing coalition that comprises 34 factions including Uruguay Assembly [Danilo ASTORI], Progressive Alliance [Rodolfo NIN NOVOA], New Space [Rafael MICHELINI], Socialist Party [Gonzalo CIVILA], Vertiente Artiguista [Enrique RUBIO], Christian Democratic Party [Jorge RODRIGUEZ], For the People’s Victory [Luis PUIG], Popular Participation Movement or MPP [Jose MUJICA], Big House [Constanza MOREIRA], Communist Party [Juan CASTILLO], The Federal League [Sergio LIER], Fuerza Renovadora [Mario BERGARA])
Colorado Party (including Batllistas [Julio Maria SANGUINETTI] and Ciudadanos [Adrian PENA])
Independent Party [Pablo MIERES]
National Party or Blanco (including Todos (Everyone) [Luis LACALLE POU] and National Alliance [Carlos CAMY])
Open Cabildo [Guido MANINI RIOS]
Popular Unity [Gonzalo ABELLA]
International organization participation: CAN (associate), CD, CELAC, FAO, G-77, IADB, IAEA, IBRD, ICAO, ICC (national committees), ICCt, ICRM, IDA, IFAD, IFC, IFRCS, IHO, ILO, IMF, IMO, Interpol, IOC, IOM, IPU, ISO, ITSO, ITU, LAES, LAIA, Mercosur, MIGA, MINUSTAH, MONUSCO, NAM (observer), OAS, OIF (observer), OPANAL, OPCW, Pacific Alliance (observer), PCA, SICA (observer), UN, UNASUR, UNCTAD, UNESCO, UNIDO, Union Latina, UNISFA, UNMOGIP, UNOCI, UNWTO, UPU, WCO, WFTU (NGOs), WHO, WIPO, WMO, WTO
Diplomatic representation in the US: chief of mission: Ambassador Andres Augusto DURAN HAREAU (since 23 December 2020)
chancery: 1913 I Street NW, Washington, DC 20006
telephone: [1] (202) 331-1313
FAX: [1] (202) 331-8142
email address and website: urueeuu@mrree.gub.uy
consulate(s) general: Miami, New York, San Francisco
Diplomatic representation from the US: chief of mission: Ambassador Heide B. FULTON (since 22 March 2023)
embassy: Lauro Muller 1776, Montevideo 11200
mailing address: 3360 Montevideo Place, Washington DC 20521-3360
telephone: (+598) 1770-2000
FAX: [+598] 1770-2128
email address and website: MontevideoACS@state.gov
Flag description: nine equal horizontal stripes of white (top and bottom) alternating with blue; a white square in the upper hoist-side corner with a yellow sun bearing a human face (delineated in black) known as the Sun of May with 16 rays that alternate between triangular and wavy; the stripes represent the nine original departments of Uruguay; the sun symbol evokes the legend of the sun breaking through the clouds on 25 May 1810 as independence was first declared from Spain (Uruguay subsequently won its independence from Brazil); the sun features are said to represent those of Inti, the Inca god of the sun
note: the banner was inspired by the national colors of Argentina and by the design of the US flag
National symbol(s): Sun of May (a sun-with-face symbol); national colors: blue, white, yellow
National anthem: name: “Himno Nacional” (National Anthem of Uruguay)
lyrics/music: Francisco Esteban ACUNA de Figueroa/Francisco Jose DEBALI
note: adopted 1848; the anthem is also known as “Orientales, la Patria o la tumba!” (“Uruguayans, the Fatherland or Death!”); it is the world’s longest national anthem in terms of music (105 bars; almost five minutes); generally only the first verse and chorus are sung
National heritage: total World Heritage Sites: 3 (all cultural)
selected World Heritage Site locales: Historic City of Colonia del Sacramento; Fray Bentos Industrial Landscape; The work of engineer Eladio Dieste: Church of Atlántida
ECONOMY
Economic overview: high-income, export-oriented South American economy; South America’s largest middle class; low socioeconomic inequality; growing homicide rates; growing Chinese and EU relations; 2019 Argentine recession hurt; key milk, beef, rice, and wool exporter
Real GDP (purchasing power parity): $78.121 billion (2021 est.)
$74.852 billion (2020 est.)
$79.733 billion (2019 est.)
note: data are in 2017 dollars
comparison ranking: 98
Real GDP growth rate: 4.37% (2021 est.)
-6.12% (2020 est.)
0.35% (2019 est.)
comparison ranking: 106
Real GDP per capita: $22,800 (2021 est.)
$21,800 (2020 est.)
$23,300 (2019 est.)
note: data are in 2017 dollars
comparison ranking: 83
GDP (official exchange rate): $56.108 billion (2019 est.)
Inflation rate (consumer prices): 7.75% (2021 est.)
9.76% (2020 est.)
7.88% (2019 est.)
comparison ranking: 38
Credit ratings:
Fitch rating: BBB- (2013)
Moody’s rating: Baa2 (2014)
Standard & Poors rating: BBB (2015)
note: The year refers to the year in which the current credit rating was first obtained.
GDP - composition, by sector of origin: agriculture: 6.2% (2017 est.)
industry: 24.1% (2017 est.)
services: 69.7% (2017 est.)
comparison rankings: services 72; industry 116; agriculture 118
GDP - composition, by end use: household consumption: 66.8% (2017 est.)
government consumption: 14.3% (2017 est.)
investment in fixed capital: 16.7% (2017 est.)
investment in inventories: -1% (2017 est.)
exports of goods and services: 21.6% (2017 est.)
imports of goods and services: -18.4% (2017 est.)
Agricultural products: soybeans, milk, rice, maize, wheat, barley, beef, sugar cane, sorghum, oranges
Industries: food processing, electrical machinery, transportation equipment, petroleum products, textiles, chemicals, beverages
Industrial production growth rate: 5.87% (2021 est.)
comparison ranking: 74
Labor force: 1.702 million (2021 est.)
comparison ranking: 131
Labor force - by occupation: agriculture: 13%
industry: 14%
services: 73% (2010 est.)
Unemployment rate: 10.45% (2021 est.)
10.35% (2020 est.)
8.88% (2019 est.)
comparison ranking: 68
Youth unemployment rate (ages 15-24): total: 32.9% (2021 est.)
male: 28.3%
female: 38.7%
comparison ranking: total 29
Population below poverty line: 8.8% (2019 est.)
Gini Index coefficient - distribution of family income: 40.2 (2020 est.)
comparison ranking: 56
Average household expenditures: on food: 18.6% of household expenditures (2018 est.)
on alcohol and tobacco: 1.3% of household expenditures (2018 est.)
Household income or consumption by percentage share: lowest 10%: 1.9%
highest 10%: 30.8% (2014 est.)
Budget: revenues: $14.991 billion (2020 est.)
expenditures: $17.571 billion (2020 est.)
Budget surplus (+) or deficit (-): -3.5% (of GDP) (2017 est.)
comparison ranking: 146
Public debt: 60.4% of GDP (2020 est.)
50.94% of GDP (2019 est.)
47.95% of GDP (2018 est.)
note: data cover general government debt and include debt instruments issued (or owned) by government entities other than the treasury; the data include treasury debt held by foreign entities; the data include debt issued by subnational entities, as well as intragovernmental debt; intragovernmental debt consists of treasury borrowings from surpluses in the social funds, such as for retirement, medical care, and unemployment; debt instruments for the social funds are not sold at public auctions.
comparison ranking: 82
Taxes and other revenues: 18.55% (of GDP) (2020 est.)
comparison ranking: 104
Fiscal year: calendar year
Current account balance: -$1.073 billion (2021 est.)
-$448.402 million (2020 est.)
$980.513 million (2019 est.)
comparison ranking: 136
Exports: $18.82 billion (2021 est.) note: data are in current year dollars
$13.596 billion (2020 est.) note: data are in current year dollars
$17.087 billion (2019 est.) note: data are in current year dollars
comparison ranking: 89
Exports - partners: China 29%, Brazil 12%, United States 5%, Netherlands 5%, Argentina 5% (2019)
Exports - commodities: sulfate wood pulp, beef, soybeans, concentrated milk, rice (2019)
Imports: $15.051 billion (2021 est.) note: data are in current year dollars
$11.212 billion (2020 est.) note: data are in current year dollars
$13.336 billion (2019 est.) note: data are in current year dollars
comparison ranking: 99
Imports - partners: Brazil 25%, China 15%, United States 11%, Argentina 11% (2019)
Imports - commodities: crude petroleum, packaged medicines, cars, broadcasting equipment, delivery trucks (2019)
Reserves of foreign exchange and gold: $16.963 billion (31 December 2021 est.)
$16.25 billion (31 December 2020 est.)
$14.504 billion (31 December 2019 est.)
comparison ranking: 69
Debt - external: $43.705 billion (2019 est.)
$42.861 billion (2018 est.)
comparison ranking: 73
Exchange rates: Uruguayan pesos (UYU) per US dollar -
Exchange rates: 43.555 (2021 est.)
42.013 (2020 est.)
35.255 (2019 est.)
30.725 (2018 est.)
28.676 (2017 est.)
ENERGY
Electricity access: electrification - total population: 100% (2021)
Electricity: installed generating capacity: 5.348 million kW (2020 est.)
consumption: 11,461,960,000 kWh (2019 est.)
exports: 1.148 billion kWh (2020 est.)
imports: 515 million kWh (2020 est.)
transmission/distribution losses: 1,329,700,000 kWh (2019 est.)
comparison rankings: imports 86; exports 58; installed generating capacity 84; transmission/distribution losses 101; consumption 95
Electricity generation sources: fossil fuels: 2% of total installed capacity (2020 est.)
solar: 3.6% of total installed capacity (2020 est.)
wind: 42.2% of total installed capacity (2020 est.)
hydroelectricity: 30.6% of total installed capacity (2020 est.)
biomass and waste: 21.6% of total installed capacity (2020 est.)
Petroleum: total petroleum production: 400 bbl/day (2021 est.)
refined petroleum consumption: 50,200 bbl/day (2019 est.)
crude oil and lease condensate exports: 0 bbl/day (2018 est.)
crude oil and lease condensate imports: 41,500 bbl/day (2018 est.)
crude oil estimated reserves: 0 barrels (2021 est.)
Refined petroleum products - production: 42,220 bbl/day (2015 est.)
comparison ranking: 81
Refined petroleum products - exports: 0 bbl/day (2015 est.)
comparison ranking: 208
Refined petroleum products - imports: 9,591 bbl/day (2015 est.)
comparison ranking: 150
Natural gas: production: 0 cubic meters (2021 est.)
consumption: 96.872 million cubic meters (2019 est.)
exports: 0 cubic meters (2021 est.)
imports: 96.872 million cubic meters (2019 est.)
proven reserves: 0 cubic meters (2021 est.)
Carbon dioxide emissions: 6.45 million metric tonnes of CO2 (2019 est.)
from petroleum and other liquids: 6.259 million metric tonnes of CO2 (2019 est.)
from consumed natural gas: 190,000 metric tonnes of CO2 (2019 est.)
comparison ranking: total emissions 129
Energy consumption per capita: 66.909 million Btu/person (2019 est.)
comparison ranking: 85
COMMUNICATIONS
Telephones - fixed lines: total subscriptions: 1.2 million (2021 est.)
subscriptions per 100 inhabitants: 36 (2021 est.)
comparison ranking: total subscriptions 68
Telephones - mobile cellular: total subscriptions: 4.7 million (2021 est.)
subscriptions per 100 inhabitants: 140 (2021 est.)
comparison ranking: total subscriptions 126
Telecommunication systems: general assessment: Uruguay has an advanced telecom market, with excellent infrastructure and one of the highest broadband penetration rates in Latin America; fixed-line teledensity is also particularly high for the region, while mobile penetration is the second highest after Panama; in terms of computer penetration, Uruguay tops all other countries in the region by a considerable margin, and this has facilitated growth in fixed-line broadband adoption; the government and telecom regulator have introduced a range of measures to help develop the deployment of fiber infrastructure, partly in a bid to encourage economic growth and stimulate e-commerce; fiber accounted for about 77% of all fixed and fixed-wireless broadband connections as of June 2020; with investment projected to reach $800 million, the state-owned incumbent Antel is expected to provide national FttP coverage by early 2022; together with the FttP network, the opening of the submarine cable system in early 2012 and August 2017 have helped boost Uruguay’s internet bandwidth, and increase the data rate available to end-users; Uruguay is one of the very few Latin American countries where the local fixed-line market is neither privatized nor liberalized; other segments of the telecom market have been opened to competition, including international long-distance telephony, mobile telephony, and fixed-wireless broadband; Uruguay is also one of the few countries in the world where broadband access via cable modem does not exist; although cable networks are well equipped technologically, and digital cable TV is widely available, telecom legislation prohibits data transmission over pay TV networks; the government announced in December 2020 that it intended to introduce changes to the law to permit pay TV providers to offer internet and telephony packages over their own networks; all three operators offer mobile broadband through 3G and LTE networks; operators have achieved nationwide 3G coverage and the number of mobile broadband subscribers continues to grow; at the end of 2019, spectrum in the 5G-suitable range was auctioned, enabling operators to launch 5G services; the regulator is working on a spectrum and connectivity policy that emphasizes 5G (2021)
domestic: fixed-line is 36 per 100 and mobile-cellular teledensity 140 per 100 persons (2021)
international: country code - 598; landing points for the Unisor, Tannat, and Bicentenario submarine cable system providing direct connectivity to Brazil and Argentina; Bicentenario 2012 and Tannat 2017 cables helped end-users with Internet bandwidth; satellite earth stations - 2 Intelsat (Atlantic Ocean) (2020)
Broadcast media: mixture of privately owned and state-run broadcast media; more than 100 commercial radio stations and about 20 TV channels; cable TV is available; many community radio and TV stations; adopted the hybrid Japanese/Brazilian HDTV standard (ISDB-T) in December 2010 (2019)
Internet country code: .uy
Internet users: total: 3.06 million (2021 est.)
percent of population: 90% (2021 est.)
comparison ranking: total 118
Broadband - fixed subscriptions: total: 1,063,701 (2020 est.)
subscriptions per 100 inhabitants: 31 (2020 est.)
comparison ranking: total 71
TRANSPORTATION
National air transport system: number of registered air carriers: 2 (2020)
inventory of registered aircraft operated by air carriers: 5
Civil aircraft registration country code prefix: CX
Airports: 133 (2021)
comparison ranking: total 42
Airports - with paved runways: 11
note: paved runways have a concrete or asphalt surface but not all have facilities for refueling, maintenance, or air traffic control; the length of a runway required for aircraft to safely operate depends on a number of factors including the type of aircraft, the takeoff weight (including passengers, cargo, and fuel), engine types, flap settings, landing speed, elevation of the airport, and average maximum daily air temperature; paved runways can reach a length of 5,000 m (16,000 ft.), but the “typical” length of a commercial airline runway is between 2,500-4,000 m (8,000-13,000 ft.)
Airports - with unpaved runways: 122
note: unpaved runways have a surface composition such as grass or packed earth and are most suited to the operation of light aircraft; unpaved runways are usually short, often less than 1,000 m (3,280 ft.) in length; airports with unpaved runways often lack facilities for refueling, maintenance, or air traffic control
Pipelines: 257 km gas, 160 km oil (2013)
Railways: total: 1,673 km (2016) (operational; government claims overall length is 2,961 km)
standard gauge: 1,673 km (2016) 1.435-m gauge
comparison ranking: total 79
Roadways: total: 77,732 km (2010)
paved: 7,743 km (2010)
unpaved: 69,989 km (2010)
comparison ranking: total 63
Waterways: 1,600 km (2011)
comparison ranking: 50
Merchant marine: total: 60 (2022)
by type: container ship 1, general cargo 4, oil tanker 4, other 51
comparison ranking: total 113
Ports and terminals: major seaport(s): Montevideo
MILITARY AND SECURITY
Military and security forces: Armed Forces of Uruguay (Fuerzas Armadas del Uruguay): National Army (Ejercito Nacional), National Navy (Armada Nacional, includes Coast Guard (Prefectura Nacional Naval or PRENA)), Uruguayan Air Force (Fuerza Aerea)
Ministry of Interior: National Police (2023)
note: the National Police includes the paramilitary National Republican Guard (Guardia Nacional Republicana); the National Police maintains internal security, while the National Directorate for Migration is responsible for migration and border enforcement
Military expenditures: 1% of GDP (2022 est.)
2.3% of GDP (2021 est.)
2% of GDP (2020 est.)
2.1% of GDP (2019 est.)
2.1% of GDP (2018 est.)
comparison ranking: 130
Military and security service personnel strengths: approximately 23,000 active-duty personnel (15,000 Army; 5,000 Navy; 3,000 Air Force) (2023)
Military equipment inventories and acquisitions: the military’s inventory includes a wide variety of older or second-hand equipment; in recent years, it has imported limited amounts of military hardware from a variety of countries with Spain as the leading supplier (2023)
Military service age and obligation: 18-30 years of age (18-22 years of age for Navy) for voluntary military service for men and women; up to 40 years of age for specialists; enlistment is voluntary in peacetime, but the government has the authority to conscript in emergencies (2023)
note: as of 2023, women comprised nearly 20% of the active military
Military deployments: 825 Democratic Republic of the Congo (MONUSCO); 210 Golan Heights (UNDOF) (2023)
Military - note: the armed forces are responsible for defense of the country’s independence, national sovereignty, and territorial integrity, as well as protecting strategic resources; it has some domestic responsibilities, including perimeter security for a number of prisons and border security and providing humanitarian/disaster assistance; in 2020, the military deployed more than 1,000 troops to assist the National Police in securing the land border with Brazil and the riverine border with Argentina as part of a border control law passed in 2018; the military trains regularly, including in multinational exercises; it has traditionally held security ties with Argentina, Brazil, Peru, and the US
the Army has 4 regionally based divisions comprised of approximately 8 small brigades of infantry and mechanized cavalry; the Navy includes the Coast Guard, a naval aviation command, and a small naval infantry force; the Navy in recent years has undertaken a modest program to modernize its aging fleet, decommissioning several ships, including its only frigates, and acquiring secondhand patrol vessels from the US Coast Guard; it is also attempting to acquire larger and more modern offshore patrol vessels; the Air Force has a single squadron of light ground attack aircraft (2023)
SPACE
Space agency/agencies: drafted a bill to establish a space agency to be named the Uruguayan Space Agency, 2022 (2023)
Space program overview: nascent program; the bill to establish a space agency declared its purpose to be promoting the development of the space sector in Uruguay with emphasis on the economic and social development of its inhabitants (2023)
note: further details about the key activities, programs, and milestones of the country’s space program, as well as government spending estimates on the space sector, appear in Appendix S
TRANSNATIONAL ISSUES
Disputes - international: Uruguay-Argentina: in 2010, the ICJ ruled in favor of Uruguay’s operation of two paper mills on the Uruguay River, which forms the border with Argentina; the two countries formed a joint pollution monitoring regime, which ended the dispute
Uruguay-Brazil: uncontested boundary dispute between Brazil and Uruguay over Braziliera/Brasiliera Island in the Quarai/Cuareim River leaves the tripoint with Argentina in question; smuggling of firearms and narcotics continues to be an issue along the Uruguay-Brazil border
Refugees and internally displaced persons: refugees (country of origin): 19,000 (Venezuela) (economic and political crisis; includes Venezuelans who have claimed asylum or have received alternative legal stay) (2022)
stateless persons: 5 (2022)
Illicit drugs: transit country for drugs mainly bound for Europe, often through sea-borne containers; limited law enforcement corruption; money laundering; weak border control along Brazilian frontier; increasing consumption of cocaine base and synthetic drugs
UZBEKISTAN
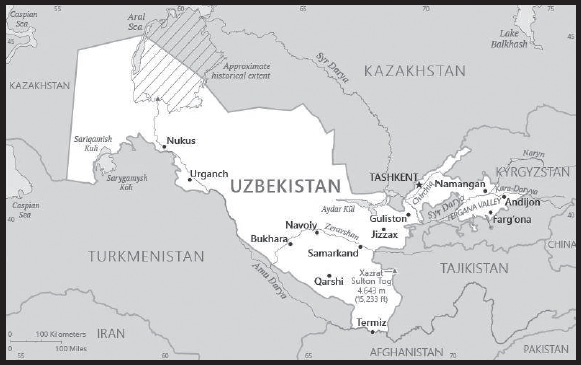
INTRODUCTION
Background: Uzbekistan is the geographic and population center of Central Asia. The country has a diverse economy and a relatively young population. Russia conquered and united the disparate territories of present-day Uzbekistan in the late 19th century. Stiff resistance to the Red Army after the Bolshevik Revolution was eventually suppressed and a socialist republic established in 1924. During the Soviet era, intensive production of “white gold” (cotton) and grain led to the overuse of agrochemicals and the depletion of water supplies, leaving the land degraded and the Aral Sea and certain rivers half-dry. Independent since the dissolution of the USSR in 1991, the country has diversified agricultural production while developing its mineral and petroleum export capacity and increasing its manufacturing base, although cotton remains a major part of its economy. Uzbekistan’s first president, Islom KARIMOV, led Uzbekistan for 25 years until his death in September 2016. His successor, former Prime Minister Shavkat MIRZIYOYEV, has improved relations with Uzbekistan’s neighbors and introduced wide-ranging economic, judicial, and social reforms. MIRZIYOYEV was reelected in October 2021 with 80% of the vote.
GEOGRAPHY
Location: Central Asia, north of Turkmenistan, south of Kazakhstan
Geographic coordinates: 41 00 N, 64 00 E
Map references: Asia
Area: total: 447,400 sq km
land: 425,400 sq km
water: 22,000 sq km
comparison ranking: total 59
Area - comparative: about four times the size of Virginia; slightly larger than California
Land boundaries: total: 6,893 km
border countries (5): Afghanistan 144 km; Kazakhstan 2,330 km; Kyrgyzstan 1,314 km; Tajikistan 1,312 km; Turkmenistan 1,793 km
Coastline: 0 km (doubly landlocked); note - Uzbekistan includes the southern portion of the Aral Sea with a 420 km shoreline
Maritime claims: none (doubly landlocked)
Climate: mostly mid-latitude desert, long, hot summers, mild winters; semiarid grassland in east
Terrain: mostly flat-to-rolling sandy desert with dunes; broad, flat intensely irrigated river valleys along course of Amu Darya, Syr Darya (Sirdaryo), and Zaravshan; Fergana Valley in east surrounded by mountainous Tajikistan and Kyrgyzstan; shrinking Aral Sea in west
Elevation: highest point: Xazrat Sulton Tog’ 4,643 m
lowest point: Sariqamish Kuli -12 m
Natural resources: natural gas, petroleum, coal, gold, uranium, silver, copper, lead and zinc, tungsten, molybdenum
Land use: agricultural land: 62.6% (2018 est.)
arable land: 10.1% (2018 est.)
permanent crops: 0.8% (2018 est.)
permanent pasture: 51.7% (2018 est.)
forest: 7.7% (2018 est.)
other: 29.7% (2018 est.)
Irrigated land: 37,320 sq km (2020)
Major lakes (area sq km): fresh water lake(s): Aral Sea (shared with Kazakhstan) - largely dried up
Major rivers (by length in km): Syr Darya (shared with Kyrgyzstan [s], Tajikistan, and Kazakhstan [m]) - 3,078 km; Amu Darya river mouth (shared with Tajikistan [s], Afghanistan, and Turkmenistan) - 2,620 km
note – [s] after country name indicates river source; [m] after country name indicates river mouth
Major watersheds (area sq km): Internal (endorheic basin) drainage: (Aral Sea basin) Amu Darya (534,739 sq km), Syr Darya (782,617 sq km)
Population distribution: most of the population is concentrated in the fertile Fergana Valley in the easternmost arm of the country; the south has significant clusters of people, while the central and western deserts are sparsely populated
Natural hazards: earthquakes; floods; landslides or mudslides; avalanches; droughts
Geography - note: along with Liechtenstein, one of the only two doubly landlocked countries in the world
PEOPLE AND SOCIETY
Population: 31,360,836 (2023 est.)
comparison ranking: 48
Nationality: noun: Uzbekistani
adjective: Uzbekistani
Ethnic groups: Uzbek 83.8%, Tajik 4.8%, Kazakh 2.5%, Russian 2.3%, Karakalpak 2.2%, Tatar 1.5%, other 2.9% (2017 est.)
Languages: Uzbek (official) 74.3%, Russian 14.2%, Tajik 4.4%, other 7.1%
major-language sample(s):
Jahon faktlari kitobi, asosiy ma’lumotlar uchun zaruriy manba. (Uzbek)
note: in the semi-autonomous Republic of Karakalpakstan, both the Karakalpak language and Uzbek have official status
Religions: Muslim 88% (mostly Sunni), Eastern Orthodox 9%, other 3%
Age structure: 0-14 years: 22.48% (male 3,612,997/female 3,437,866)
15-64 years: 70.64% (male 11,055,763/female 11,097,841)
65 years and over: 6.88% (2023 est.) (male 933,134/female 1,223,235)
Dependency ratios: total dependency ratio: 54
youth dependency ratio: 46.3
elderly dependency ratio: 7.2
potential support ratio: 13 (2021 est.)
Median age: total: 28.7 years (2023 est.)
male: 27.9 years
female: 29.5 years
comparison ranking: total 145
Population growth rate: 1.61% (2023 est.)
comparison ranking: 60
Birth rate: 22.2 births/1,000 population (2023 est.)
comparison ranking: 56
Death rate: 5.2 deaths/1,000 population (2023 est.)
comparison ranking: 189
Net migration rate: -0.9 migrant(s)/1,000 population (2023 est.)
comparison ranking: 142
Population distribution: most of the population is concentrated in the fertile Fergana Valley in the easternmost arm of the country; the south has significant clusters of people, while the central and western deserts are sparsely populated
Urbanization: urban population: 50.5% of total population (2023)
rate of urbanization: 1.25% annual rate of change (2020-25 est.)
Major urban areas - population: 2.603 million TASHKENT (capital) (2023)
Sex ratio: at birth: 1.08 male(s)/female
0-14 years: 1.05 male(s)/female
15-64 years: 1 male(s)/female
65 years and over: 0.76 male(s)/female
total population: 1.01 male(s)/female (2023 est.)
Mother’s mean age at first birth: 23.7 years (2019 est.)
Maternal mortality ratio: 30 deaths/100,000 live births (2020 est.)
comparison ranking: 110
Infant mortality rate: total: 18.9 deaths/1,000 live births (2023 est.)
male: 21.9 deaths/1,000 live births
female: 15.7 deaths/1,000 live births
comparison ranking: total 83
Life expectancy at birth: total population: 75.8 years (2023 est.)
male: 73.2 years
female: 78.6 years
comparison ranking: total population 118
Total fertility rate: 2.92 children born/woman (2023 est.)
comparison ranking: 52
Gross reproduction rate: 1.41 (2023 est.)
Drinking water source: improved: urban: 99.6% of population
rural: 96.1% of population
total: 97.8% of population
unimproved: urban: 0.4% of population
rural: 3.9% of population
total: 2.2% of population (2020 est.)
Current health expenditure: 6.8% of GDP (2020)
Physicians density: 2.37 physicians/1,000 population (2014)
Hospital bed density: 4 beds/1,000 population (2014)
Sanitation facility access: improved: total: 100% of population
unimproved: total: 0% of population (2020 est.)
Obesity - adult prevalence rate: 16.6% (2016)
comparison ranking: 123
Alcohol consumption per capita: total: 2.45 liters of pure alcohol (2019 est.)
beer: 0.18 liters of pure alcohol (2019 est.)
wine: 0.09 liters of pure alcohol (2019 est.)
spirits: 2.19 liters of pure alcohol (2019 est.)
other alcohols: 0 liters of pure alcohol (2019 est.)
comparison ranking: total 124
Tobacco use: total: 17.6% (2020 est.)
male: 34% (2020 est.)
female: 1.1% (2020 est.)
comparison ranking: total 96
Children under the age of 5 years underweight: 1.8% (2021)
comparison ranking: 107
Currently married women (ages 15-49): 68.6% (2023 est.)
Child marriage: women married by age 15: 0.2%
women married by age 18: 3.4% (2022 est.)
Education expenditures: 4.9% of GDP (2020 est.)
comparison ranking: 82
Literacy: definition: age 15 and over can read and write
total population: 100%
male: 100%
female: 100% (2019)
School life expectancy (primary to tertiary education): total: 12 years
male: 12 years
female: 12 years (2021)
Youth unemployment rate (ages 15-24): total: 16% (2021 est.)
male: 15.8%
female: 16.2%
comparison ranking: total 108
ENVIRONMENT
Environment - current issues: shrinkage of the Aral Sea has resulted in growing concentrations of chemical pesticides and natural salts; these substances are then blown from the increasingly exposed lake bed and contribute to desertification and respiratory health problems; water pollution from industrial wastes and the heavy use of fertilizers and pesticides is the cause of many human health disorders; increasing soil salination; soil contamination from buried nuclear processing and agricultural chemicals, including DDT
Environment - international agreements: party to: Biodiversity, Climate Change, Climate Change-Kyoto Protocol, Climate Change-Paris Agreement, Comprehensive Nuclear Test Ban, Desertification, Endangered Species, Environmental Modification, Hazardous Wastes, Ozone Layer Protection, Wetlands
signed, but not ratified: none of the selected agreements
Climate: mostly mid-latitude desert, long, hot summers, mild winters; semiarid grassland in east
Land use: agricultural land: 62.6% (2018 est.)
arable land: 10.1% (2018 est.)
permanent crops: 0.8% (2018 est.)
permanent pasture: 51.7% (2018 est.)
forest: 7.7% (2018 est.)
other: 29.7% (2018 est.)
Urbanization: urban population: 50.5% of total population (2023)
rate of urbanization: 1.25% annual rate of change (2020-25 est.)
Revenue from forest resources: 0% of GDP (2018 est.)
comparison ranking: 176
Revenue from coal: 0.06% of GDP (2018 est.)
comparison ranking: 30
Air pollutants: particulate matter emissions: 40.98 micrograms per cubic meter (2019 est.)
carbon dioxide emissions: 91.81 megatons (2016 est.)
methane emissions: 96.16 megatons (2020 est.)
Waste and recycling: municipal solid waste generated annually: 4 million tons (2016 est.)
Major lakes (area sq km): fresh water lake(s): Aral Sea (shared with Kazakhstan) - largely dried up
Major rivers (by length in km): Syr Darya (shared with Kyrgyzstan [s], Tajikistan, and Kazakhstan [m]) - 3,078 km; Amu Darya river mouth (shared with Tajikistan [s], Afghanistan, and Turkmenistan) - 2,620 km
note – [s] after country name indicates river source; [m] after country name indicates river mouth
Major watersheds (area sq km): Internal (endorheic basin) drainage: (Aral Sea basin) Amu Darya (534,739 sq km), Syr Darya (782,617 sq km)
Total water withdrawal: municipal: 2.41 billion cubic meters (2020 est.)
industrial: 2.13 billion cubic meters (2020 est.)
agricultural: 54.36 billion cubic meters (2020 est.)
Total renewable water resources: 48.87 billion cubic meters (2020 est.)
GOVERNMENT
Country name: conventional long form: Republic of Uzbekistan
conventional short form: Uzbekistan
local long form: O’zbekiston Respublikasi
local short form: O’zbekiston
former: Uzbek Soviet Socialist Republic
etymology: a combination of the Turkic words “uz” (self) and “bek” (master) with the Persian suffix “-stan” (country) to give the meaning “Land of the Free”
Government type: presidential republic; highly authoritarian
Capital: name: Tashkent (Toshkent)
geographic coordinates: 41 19 N, 69 15 E
time difference: UTC+5 (10 hours ahead of Washington, DC, during Standard Time)
etymology: tash means “stone” and kent means “city” in Turkic languages, so the name simply denotes “stone city”
Administrative divisions: 12 provinces (viloyatlar, singular - viloyat), 1 autonomous republic* (avtonom respublikasi), and 1 city** (shahar); Andijon Viloyati, Buxoro Viloyati [Bukhara Province], Farg’ona Viloyati [Fergana Province], Jizzax Viloyati, Namangan Viloyati, Navoiy Viloyati, Qashqadaryo Viloyati (Qarshi), Qoraqalpog’iston Respublikasi [Karakalpakstan Republic]* (Nukus), Samarqand Viloyati [Samarkand Province], Sirdaryo Viloyati (Guliston), Surxondaryo Viloyati (Termiz), Toshkent Shahri [Tashkent City]**, Toshkent Viloyati [Tashkent Province], Xorazm Viloyati (Urganch)
note: administrative divisions have the same names as their administrative centers (exceptions have the administrative center name following in parentheses)
Independence: 1 September 1991 (from the Soviet Union)
National holiday: Independence Day, 1 September (1991)
Constitution: history: several previous; latest adopted 8 December 1992
amendments: proposed by the Supreme Assembly or by referendum; passage requires two-thirds majority vote of both houses of the Assembly or passage in a referendum; amended several times, last in 2023
note: in a public referendum passed in April 2023, among the changes were the extension of the presidential term to 7 years from 5 years, and modifications to the structure and powers of the Supreme Assembly and to the criminal code
Legal system: civil law system; note - in early 2020, the president signed an amendment to the criminal code, criminal procedure code, and code of administrative responsibility; a constitutional referendum passed in April 2023 included criminal code reforms
International law organization participation: has not submitted an ICJ jurisdiction declaration; non-party state to the ICCt
Citizenship: citizenship by birth: no
citizenship by descent only: at least one parent must be a citizen of Uzbekistan
dual citizenship recognized: no
residency requirement for naturalization: 5 years
Suffrage: 18 years of age; universal
Executive branch: chief of state: President Shavkat MIRZIYOYEV (since 14 December 2016)
head of government: Prime Minister Abdulla ARIPOV (since 14 December 2016)
cabinet: Cabinet of Ministers appointed by the president with most requiring approval of the Senate chamber of the Supreme Assembly (Oliy Majlis)
elections/appointments: president directly elected by absolute majority popular vote in 2 rounds if needed for a 7-year term (eligible for a second term; previously a 5-year term, extended to 7 years by a 2023 constitutional amendment); election last held on 24 October 2021 (next to be held in 2026); prime minister nominated by majority party in legislature since 2011, but appointed along with the ministers and deputy ministers by the president
election results: 2021: Shavkat MIRZIYOYEV reelected president in first round; percent of vote - Shavkat MIRZIYOYEV (LDPU) 80.3%, Maqsuda VORISOVA (PDP) 6.7%, Alisher QODIROV (National Revival Democratic Party) 5.5%, Narzullo OBLOMURODOV (Ecological Party) 4.1%, Bahrom ABDUHALIMOV (Adolat) 3.4%
2016: Shavkat MIRZIYOYEV elected president in first round; percent of vote - Shavkat MIRZIYOYEV (LDPU) 88.6%, Hotamjon KETMONOV (PDP) 3.7%, Narimon UMAROV (Adolat) 3.5%, Sarvar OTAMURODOV (National Revival Democratic Party) 2.4%, other 1.8%
Legislative branch: description: bicameral Supreme Assembly or Oliy Majlis consists of:
Senate or Senat (100 seats); 84 members indirectly elected by regional governing councils and 16 appointed by the president; members serve 5-year terms); note - amendments to the constitution approved in April 2023 call for the reduction of Senate seats to 65 from 100
Legislative Chamber or Qonunchilik Palatasi (150 seats statutory, 140 seats current; members directly elected in singleseat constituencies by absolute majority vote with a second round if needed; members serve 5-year terms)
elections: Senate - last held 16-17 January 2020 (next to be held in 2025)
Legislative Chamber - last held on 22 December 2019 and 5 January 2020 (next to be held in December 2024)
election results: Senate - percent of vote by party - NA; seats by party - NA; composition as of May 2023 (90 members) - men 68, women 22, percent of women 24.4%
Legislative Chamber - percent of vote by party - NA; seats by party - LDPU 53, National Revival Democratic Party 36, Adolat 24, PDP 22, Ecological Movement 15; composition as of May 2023 (140 members) - men 93, women, 47, percent of women 33.6%; note - total Supreme Assembly percent of women 30%
note: all parties in the Supreme Assembly support President Shavkat MIRZIYOYEV
Judicial branch: highest court(s): Supreme Court (consists of 67 judges organized into administrative, civil, criminal, and economic sections); Constitutional Court (consists of 7 judges)
judge selection and term of office: judges of the highest courts nominated by the president and confirmed by the Senate of the Oliy Majlis; judges appointed for a single 10-year term; the court chairman and deputies appointed for 10- year terms without the right to reelection. (Article 132 of the constitution)
subordinate courts: regional, district, city, and town courts
Political parties and leaders: Ecological Party of Uzbekistan (O’zbekiston Ekologik Partivasi) [Narzullo OBLOMURODOV]
Justice (Adolat) Social Democratic Party of Uzbekistan [Bahrom ABDUKHALIMOV]
Liberal Democratic Party of Uzbekistan (O’zbekiston Liberal-Demokratik Partiyasi) or LDPU [Aktam HAITOV]
National Revival Democratic Party of Uzbekistan (O’zbekiston Milliy Tiklanish Demokratik Partiyasi) [Alisher QODIROV]
People’s Democratic Party of Uzbekistan (Xalq Demokratik Partiyas) or PDP [Ulugbek Ilyosovich INOYATOV] (formerly Communist Party)
International organization participation: ADB, CICA, CIS, EAEU (observer), EAPC, EBRD, ECO, EEU (observer), FAO, IAEA, IBRD, ICAO, ICC (national committees), ICCt, ICRM, IDA, IDB, IFAD, IFC, IFRCS, ILO, IMF, Interpol, IOC, ISO, ITSO, ITU, MIGA, NAM, OIC, OPCW, OSCE, PFP, SCO, UN, UNCTAD, UNESCO, UNHRC, UNIDO, UNWTO, UPU, WCO, WFTU (NGOs), WHO, WIPO, WMO, WTO (observer)
Diplomatic representation in the US: chief of mission: Ambassador Furqat SIDIKOV (since 19 April 2023)
chancery: 1746 Massachusetts Avenue NW, Washington, DC 20036
telephone: [1] (202) 887-5300
FAX: [1] (202) 293-6804
email address and website: info.washington@mfa.uz
consulate(s) general: New York
Diplomatic representation from the US: chief of mission: Ambassador Jonathan HENICK (since 14 October 2022)
embassy: 3 Moyqorghon, 5th Block, Yunusobod District, 100093 Tashkent
mailing address: 7110 Tashkent Place, Washington DC 20521-7110
telephone: [998] 78-120-5450
FAX: [998] 78-120-6335
email address and website: ACSTashkent@state.gov
Flag description: three equal horizontal bands of blue (top), white, and green separated by red fimbriations with a vertical, white crescent moon (closed side to the hoist) and 12 white, five-pointed stars shifted to the hoist on the top band; blue is the color of the Turkic peoples and of the sky, white signifies peace and the striving for purity in thoughts and deeds, while green represents nature and is the color of Islam; the red stripes are the vital force of all living organisms that links good and pure ideas with the eternal sky and with deeds on earth; the crescent represents Islam and the 12 stars the months and constellations of the Uzbek calendar
National symbol(s): khumo (mythical bird); national colors: blue, white, red, green
National anthem: name: “O’zbekiston Respublikasining Davlat Madhiyasi” (National Anthem of the Republic of Uzbekistan)
lyrics/music: Abdulla ARIPOV/Mutal BURHANOV
note: adopted 1992; after the fall of the Soviet Union, Uzbekistan kept the music of the anthem from its time as a Soviet Republic but adopted new lyrics
National heritage: total World Heritage Sites: 6 (5 cultural, 1 natural)
selected World Heritage Site locales: Itchan Kala (c); Historic Bukhara (c); Historic Shakhrisyabz (c); Samarkand - Crossroad of Cultures (c); Western Tien Shan (n); Silk Roads: Zarafshan-Karakum Corridor (c)
ECONOMY
Economic overview: lower middle-income Central Asian economy; CIS Free Trade Area member but no intention of EAEU membership; key natural gas, cotton, and gold exporter; landlocked and environmentally fragile; positive growth through COVID-19, but poverty increasing
Real GDP (purchasing power parity): $270.062 billion (2021 est.)
$251.408 billion (2020 est.)
$246.753 billion (2019 est.)
note: data are in 2017 dollars
comparison ranking: 60
Real GDP growth rate: 7.42% (2021 est.)
1.89% (2020 est.)
5.71% (2019 est.)
comparison ranking: 51
Real GDP per capita: $7,700 (2021 est.)
$7,300 (2020 est.)
$7,300 (2019 est.)
note: data are in 2017 dollars
comparison ranking: 159
GDP (official exchange rate): $57.789 billion (2019 est.)
Inflation rate (consumer prices): 10.85% (2021 est.)
12.87% (2020 est.)
14.53% (2019 est.)
note: official data; based on independent analysis of consumer prices, inflation reached 22% in 2012
comparison ranking: 22
Credit ratings:
Fitch rating: BB- (2018)
Moody’s rating: B1 (2019)
Standard & Poors rating: BB- (2018)
note: The year refers to the year in which the current credit rating was first obtained.
GDP - composition, by sector of origin: agriculture: 17.9% (2017 est.)
industry: 33.7% (2017 est.)
services: 48.5% (2017 est.)
comparison rankings: services 186; industry 51; agriculture 55
GDP - composition, by end use: household consumption: 59.5% (2017 est.)
government consumption: 16.3% (2017 est.)
investment in fixed capital: 25.3% (2017 est.)
investment in inventories: 3% (2017 est.)
exports of goods and services: 19% (2017 est.)
imports of goods and services: -20% (2017 est.)
Agricultural products: milk, wheat, potatoes, carrots/turnips, cotton, tomatoes, vegetables, grapes, onions, watermelons
Industries: textiles, food processing, machine building, metallurgy, mining, hydrocarbon extraction, chemicals
Industrial production growth rate: 8.37% (2021 est.)
comparison ranking: 48
Labor force: 14.094 million (2021 est.)
comparison ranking: 45
Labor force - by occupation: agriculture: 25.9%
industry: 13.2%
services: 60.9% (2012 est.)
Unemployment rate: 7.16% (2021 est.)
7.04% (2020 est.)
5.85% (2019 est.)
note: official data; another 20% are underemployed
comparison ranking: 110
Youth unemployment rate (ages 15-24): total: 16% (2021 est.)
male: 15.8%
female: 16.2%
comparison ranking: total 108
Population below poverty line: 14.1% (2013 est.)
Gini Index coefficient - distribution of family income: 36.8 (2003 est.)
comparison ranking: 81
Average household expenditures: on food: 30.2% of household expenditures (2018 est.)
on alcohol and tobacco: 2.5% of household expenditures (2018 est.)
Household income or consumption by percentage share: lowest 10%: 2.8%
highest 10%: 29.6% (2003)
Budget: revenues: $16.197 billion (2019 est.)
expenditures: $16.346 billion (2019 est.)
Budget surplus (+) or deficit (-): 0.3% (of GDP) (2017 est.)
comparison ranking: 41
Public debt: 24.3% of GDP (2017 est.)
10.5% of GDP (2016 est.)
comparison ranking: 180
Taxes and other revenues: 14.87% (of GDP) (2020 est.)
comparison ranking: 148
Fiscal year: calendar year
Current account balance: -$4.825 billion (2021 est.)
-$3.007 billion (2020 est.)
-$3.366 billion (2019 est.)
comparison ranking: 188
Exports: $16.399 billion (2021 est.) note: data are in current year dollars
$14.532 billion (2020 est.) note: data are in current year dollars
$16.993 billion (2019 est.) note: data are in current year dollars
comparison ranking: 90
Exports - partners: Switzerland 19%, United Kingdom 17%, Russia 15%, China 14%, Kazakhstan 9%, Turkey 8%, Kyrgyzstan 5% (2019)
Exports - commodities: gold, natural gas, cotton fibers, copper, ethylene polymers (2019)
Imports: $27.774 billion (2021 est.) note: data are in current year dollars
$22.56 billion (2020 est.) note: data are in current year dollars
$26.551 billion (2019 est.) note: data are in current year dollars
comparison ranking: 76
Imports - partners: China 23%, Russia 18%, South Korea 11%, Kazakhstan 9%, Turkey 6%, Germany 5% (2019)
Imports - commodities: cars and vehicle parts, packaged medicines, refined petroleum, aircraft, construction vehicles (2019)
Reserves of foreign exchange and gold: $35.375 billion (31 December 2021 est.)
$34.903 billion (31 December 2020 est.)
$29.291 billion (31 December 2019 est.)
comparison ranking: 55
Debt - external: $16.9 billion (31 December 2017 est.)
$16.76 billion (31 December 2016 est.)
comparison ranking: 101
Exchange rates: Uzbekistani soum (UZS) per US dollar -
Exchange rates: 10,609.464 (2021 est.)
10,054.261 (2020 est.)
8,836.788 (2019 est.)
8,069.606 (2018 est.)
5,113.879 (2017 est.)
ENERGY
Electricity access: electrification - total population: 99.9% (2020)
electrification - urban areas: 100% (2021)
electrification - rural areas: 99.7% (2021)
Electricity: installed generating capacity: 16.042 million kW (2020 est.)
consumption: 57,605,687,000 kWh (2019 est.)
exports: 2.067 billion kWh (2019 est.)
imports: 3.379 billion kWh (2019 est.)
transmission/distribution losses: 3.858 billion kWh (2019 est.)
comparison rankings: installed generating capacity 53; transmission/distribution losses 55; imports 48; exports 50; consumption 47
Electricity generation sources: fossil fuels: 88.1% of total installed capacity (2020 est.)
hydroelectricity: 11.9% of total installed capacity (2020 est.)
Coal: production: 3.98 million metric tons (2020 est.)
consumption: 5.668 million metric tons (2020 est.)
exports: 1,000 metric tons (2020 est.)
imports: 2.995 million metric tons (2020 est.)
proven reserves: 1.375 billion metric tons (2019 est.)
Petroleum: total petroleum production: 5,200 bbl/day (2021 est.)
refined petroleum consumption: 98,200 bbl/day (2019 est.)
crude oil and lease condensate exports: 0 bbl/day (2018 est.)
crude oil and lease condensate imports: 24,000 bbl/day (2018 est.)
crude oil estimated reserves: 594 million barrels (2021 est.)
Refined petroleum products - production: 61,740 bbl/day (2015 est.)
comparison ranking: 78
Refined petroleum products - exports: 3,977 bbl/day (2015 est.)
comparison ranking: 95
Refined petroleum products - imports: 0 bbl/day (2015 est.)
comparison ranking: 214
Natural gas: production: 46,968,227,000 cubic meters (2020 est.)
consumption: 43,882,007,000 cubic meters (2019 est.)
exports: 13,283,524,000 cubic meters (2019 est.)
imports: 0 cubic meters (2020 est.)
proven reserves: 1,840,592,000,000 cubic meters (2021 est.)
Carbon dioxide emissions: 102.965 million metric tonnes of CO2 (2019 est.)
from coal and metallurgical coke: 7.816 million metric tonnes of CO2 (2019 est.)
from petroleum and other liquids: 11.53 million metric tonnes of CO2 (2019 est.)
from consumed natural gas: 83.619 million metric tonnes of CO2 (2019 est.)
comparison ranking: total emissions 42
Energy consumption per capita: 57.709 million Btu/person (2019 est.)
comparison ranking: 94
COMMUNICATIONS
Telephones - fixed lines: total subscriptions: 3,470,097 (2021 est.)
subscriptions per 100 inhabitants: 17 (2021 est.)
comparison ranking: total subscriptions 36
Telephones - mobile cellular: total subscriptions: 35 million (2021 est.)
subscriptions per 100 inhabitants: 100 (2021 est.)
comparison ranking: total subscriptions 43
Telecommunication systems: general assessment: Uzbekistan’s telecom markets both wireline and wireless have been playing “catch up” in terms of their development following the country’s independence from the former Soviet Union; the government has formally adopted the principles of operating as a market economy, many elements of the old centrally planned economic model remain; this has had the effect of reducing the level of interest from foreign companies and investors in building out the necessary underlying infrastructure, which in turn has constrained the rate of growth in the country’s telecoms sector; the last five years has seen an upswing in prospects for the sector as fiber network roll outs continue beyond the main urban centers, while the mobile market experiences some consolidation for stronger, more efficient competitors; growth is present in the fixed broadband segment with penetration projected to reach 24% by 2027 (a 5-year CAGR of 6.2%); despite the promising signs in the fixed markets, it is the mobile segment that continues to dominate Uzbekistan’s telecoms sector in terms of penetration, revenue, and growth; there are four major operators providing a modicum of competition; three of the four are government owned entities; the mobile market is expected to reach 100% penetration in 2023 a 50% increase in the last five years (2022)
domestic: fixed-line nearly 17 per 100 persons and mobile-cellular teledensity of 100 per 100 persons (2021)
international: country code - 998; linked by fiber-optic cable or microwave radio relay with CIS member states and to other countries by leased connection via the Moscow international gateway switch; the country also has a link to the Trans-Asia-Europe (TAE) fiber-optic cable; Uzbekistan has supported the national fiber-optic backbone project of Afghanistan since 2008
Broadcast media: the government controls media; 17 state-owned broadcasters - 13 TV and 4 radio - provide service to virtually the entire country; about 20 privately owned TV stations, overseen by local officials, broadcast to local markets; privately owned TV stations are required to lease transmitters from the government-owned Republic TV and Radio Industry Corporation; in 2019, the Uzbek Agency for Press and Information was reorganized into the Agency of Information and Mass Communications and became part of the Uzbek Presidential Administration (2019)
Internet country code: .uz
Internet users: total: 26.18 million (2021 est.)
percent of population: 77% (2021 est.)
comparison ranking: total 34
Broadband - fixed subscriptions: total: 4,820,009 (2020 est.)
subscriptions per 100 inhabitants: 14 (2020 est.)
comparison ranking: total 33
TRANSPORTATION
National air transport system: number of registered air carriers: 2 (2020)
inventory of registered aircraft operated by air carriers: 34
annual passenger traffic on registered air carriers: 3,056,558 (2018)
annual freight traffic on registered air carriers: 89.43 million (2018) mt-km
Civil aircraft registration country code prefix: UK
Airports: 53 (2021)
comparison ranking: total 88
Airports - with paved runways: 33
civil airports: 9
military airports: 3
joint use (civil-military) airports: 1
other airports: 20
note: paved runways have a concrete or asphalt surface but not all have facilities for refueling, maintenance, or air traffic control; the length of a runway required for aircraft to safely operate depends on a number of factors including the type of aircraft, the takeoff weight (including passengers, cargo, and fuel), engine types, flap settings, landing speed, elevation of the airport, and average maximum daily air temperature; paved runways can reach a length of 5,000 m (16,000 ft.), but the “typical” length of a commercial airline runway is between 2,500-4,000 m (8,000-13,000 ft.)
Airports - with unpaved runways: 20
note: unpaved runways have a surface composition such as grass or packed earth and are most suited to the operation of light aircraft; unpaved runways are usually short, often less than 1,000 m (3,280 ft.) in length; airports with unpaved runways often lack facilities for refueling, maintenance, or air traffic control
Pipelines: 13,700 km gas, 944 km oil (2016)
Railways: total: 4,642 km (2018)
broad gauge: 4,642 km (2018) 1.520-m gauge (1,684 km electrified)
comparison ranking: total 41
Roadways: total: 86,496 km (2000)
paved: 75,511 km (2000)
unpaved: 10,985 km (2000)
comparison ranking: total 56
Waterways: 1,100 km (2012)
comparison ranking: 66
Ports and terminals: river port(s): Termiz (Amu Darya)
MILITARY AND SECURITY
Military and security forces: Armed Forces of Uzbekistan: Army, Air and Air Defense Forces; National Guard
Ministry of Internal Affairs: Internal Security Troops, Border Guards, police (2023)
note: the National Guard is under the Defense Ministry, but is independent of the other military services; it is responsible for ensuring public order and the security of diplomatic missions, radio and television broadcasting, and other state entities
Military expenditures: 2.8% of GDP (2019 est.)
2.9% of GDP (2018 est.)
2.7% of GDP (2017 est.)
2.5% of GDP (2016 est.)
2.5% of GDP (2015 est.)
comparison ranking: 33
Military and security service personnel strengths: information varies; approximately 50-60,000 active-duty troops, including 10-15,000 Air Force (2023)
Military equipment inventories and acquisitions: the Uzbek Armed Forces use mainly Soviet-era equipment; in recent years, Russia has been the leading supplier of arms, followed by China (2023)
Military service age and obligation: 18-27 years of age for compulsory military service; 12-month conscript service obligation for men (those conscripted have the option of paying for a shorter service of 1 month while remaining in the reserves until the age of 27) (2023)
note: Uzbek citizens who have completed their service terms in the armed forces have privileges in employment and admission to higher educational institutions
Military - note: the military’s primary concerns and responsibilities are border security, ensuring the country’s sovereignty and territorial integrity, instability in neighboring countries, and terrorism; the military is equipped largely with Soviet-era arms and its units are based on Soviet Army formations that were in the territory of Uzbekistan when the USSR collapsed in 1991; the armed forces were established in January 1992 when Uzbekistan assumed jurisdiction over all former Soviet ground, air, and air defense units, formations, and installations then deployed on its soil; the building hosting the headquarters for the ex-Soviet Turkestan Military District became the headquarters for the Uzbek armed forces; all former Soviet troops departed Uzbekistan by 1995
the Army has up to 15 combat brigades, mostly motorized or mechanized infantry, as well as air assault, artillery, special forces, and tank brigades; the Air Force received a considerable number of aircraft inherited from the Soviet Union in the 1990s and continues to have an inventory estimated to be more than 100 combat aircraft and combat helicopters
Uzbekistan joined the Russian-sponsored Collective Security Treaty Organization (CSTO) in the 1990s but withdrew in 1999; it returned in 2006 but left again in 2012; although it is not part of CSTO, Uzbekistan continues to maintain defense ties with Russia, including joint military exercises and defense industrial cooperation; it also has defense ties with other regional countries, including India, Pakistan, and Turkey; it is part of the Shanghai Cooperation Organization (SCO) and participates in SCO training exercises (2023)
SPACE
Space agency/agencies: Agency for Space Research and Technology (Uzbekcosmos; established 2019) (2023)
Space program overview: has a small space program focused on acquiring satellites and developing the country’s space industry; Uzbekcosmos largely sets state policy and shapes the strategic direction, development, and use of the country’s space-related industries and technologies in key sectors, including cartography, environmental and disaster monitoring, land use, resource management, and telecommunications; also has an astronomy program; cooperates with foreign space agencies and commercial companies, including those of China, France, India, Kazakhstan, Russia, and South Korea (2023)
note: further details about the key activities, programs, and milestones of the country’s space program, as well as government spending estimates on the space sector, appear in Appendix S
TERRORISM
Terrorist group(s): Terrorist group(s): Islamic Jihad Union; Islamic Movement of Uzbekistan; Islamic State of Iraq and ash-Sham - Khorasan (ISIS-K)
note 1: these groups have typically been active in the area where the Uzbek, Kyrgyz, and Tajik borders converge and ill-defined and porous borders allow for the relatively free movement of people and illicit goods
note 2: details about the history, aims, leadership, organization, areas of operation, tactics, targets, weapons, size, and sources of support of the group(s) appear(s) in Appendix-T
TRANSNATIONAL ISSUES
Disputes - international: Uzbekistan-Afghanistan: none identified
Uzbekistan-Kazakhstan: field demarcation of the boundaries with Kazakhstan commenced in 2004; disputed territory is held by Uzbekistan, but the overwhelming majority of residents are ethnic Kazakhs; the two countries agreed on draft final demarcation documents in March 2022 and signed an agreement demarcating their border in December 2022
Uzbekistan-Kyrgyzstan: border delimitation of 130 km of border with Kyrgyzstan is hampered by serious disputes around enclaves and other areas; in 2021, border talks between Uzbek and Kyrgyz officials raised the possibility of a land swap arrangement, but a deal was not finalized
Uzbekistan-Tajikistan: none identified
Uzbekistan-Turkmenistan: prolonged drought and cotton monoculture in Uzbekistan and Turkmenistan created water-sharing difficulties for Amu Darya river states; in 2021, the two countries reached an agreement to create a joint intergovernmental commission to oversee water management
Refugees and internally displaced persons: refugees (country of origin): 13,031 (Afghanistan) (mid-year 2022)
stateless persons: 31,829 (2022)
Illicit drugs: a transit country for Afghan heroin, opium, and hashish destined to Kazakhstan, Russia, and Europe; cannabis and opium poppy are grown domestically for personal use and sale